In wondering what the new year has in store for the insurance industry, Marsh hosted “The New Reality of Risk – U.S. Insurance Markets and Risk Trends in 2013,” a webinar produced on the heels of their Insurance Market Report 2013 publication. The webinar touched on firming in the market, Superstorm Sandy, cat models and workers comp, among other things, with insights from:
- Dean Klisura, U.S. risk practices leader for Marsh
- Cliff Rich, managing director in Guy Carpenter’s global business intelligence unit
- Duncan Ellis, Marsh’s U.S. property practice leader
- Jon Zaffino, Marsh’s U.S. casualty practice leader
- Chris Lang, U.S. placement leader for Marsh’s FINPRO practice
- Claude Yoder, head of Marsh global analytics
Catastrophe Market
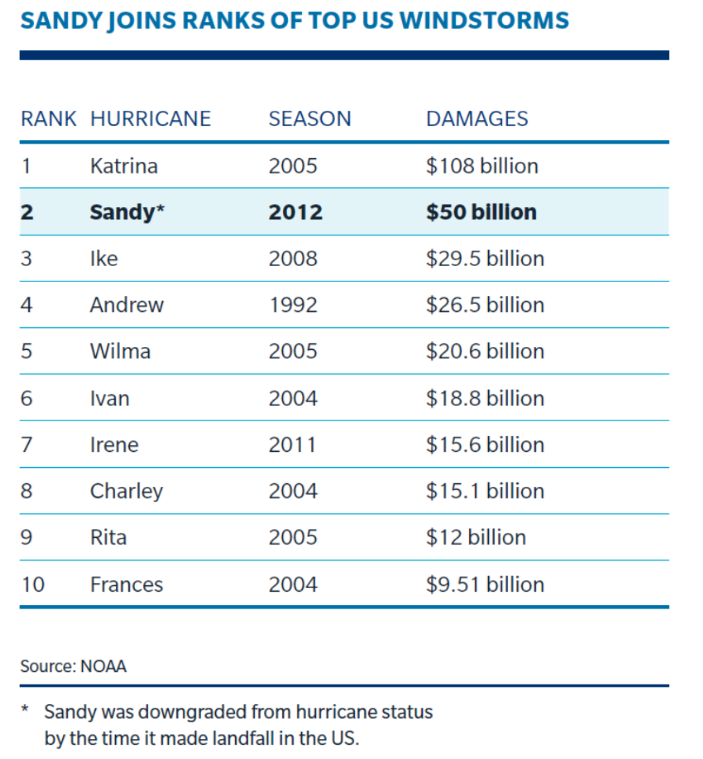
“One thing we have seen change dramatically in the past two years relates to cat losses,” said Klisura. As he noted, insured losses over the past 10 years have averaged $50 billion, with a spike in 2011. The industry has experienced two straight years of well above average losses — coupled with feeling the effects of low interest rates and a shaky economy. “However, the industry still remains well capitalized,” Klisura remarked.
Klisura doesn’t envision a hardening environment, but claims certain sectors of the market are in transition. “A few things risk managers should keep an eye on in 2013 are cat exposed property risk, including risk with flood zone exposures — it will be a big one,” said Klisura. He also noted that certain sectors of workers comp market will may experience changes along with complex financial institution risk and competition among insurers, which is expected to remain intense in 2013.
Reinsurance
The reinsurance market at January 1 was characterized as stable. Superstorm Sandy, crop losses and other severe weather outbreaks resulted in global losses of $60 billion, which was less than 2011 losses, but the sector continues to be challenged by the macroeconomic environment — namely, the economy. “Casualty rates increased modestly in 2012 but at January 1, 2013, renewal rates, casualty pricing stabilized,” said Cliff Rich.
Cat Limits
According to the panelists, carriers are being a little more stingy around cat limits. For cat sub limits, they are seeing carriers limiting the amount of flood coverage. For deductibles, they’re seeing a push for per-location deductibles on flood vs traditional per-occurrence deductibles. For premiums, there is renewed pressure on some cat exposed insureds and on a client by client basis. “For 2013, I think it’s much of the same we’ve seen,” said Ellis. “2012 could be the third year in a row that property insurers have not realized a profit. The big unknown? 2013 losses.” There is a potential for “trading” between retention and premium, he explained.
Cat Models
In terms of catastrophe models, Ellis feels they will change to take into account both Irene, which had insured losses of $4.4 billion, and Sandy, which had insured losses of $18 to $25 billion. This drives home the point that insureds should provide high quality data for models. “What I’ve heard is that losses from Sandy are what was expected from modeling,” Ellis said. “But models will change.”
There are several widely used models for wind and earthquake, Ellis pointed out. But that’s not the case with flood, despite flooding being the loss leading peril over the last few years. “There’s nothing consistent market-wide yet,” he said.
Casualty Market
Jon Zaffino explained that insurer competition is strong. However, challenges may arise from clients with difficult loss experience and certain individual risks, or line of business characteristics. “It’s a tug of war between the technical and trading environment,” he said. “We may see rates flattening in some lines in 2nd half of 2013.”
- Technical – macro factors such as loos-cost trend, interest rates, etc.
- Trading – insurance supply/insurer appetite and market depth and breadth
Workers Comp
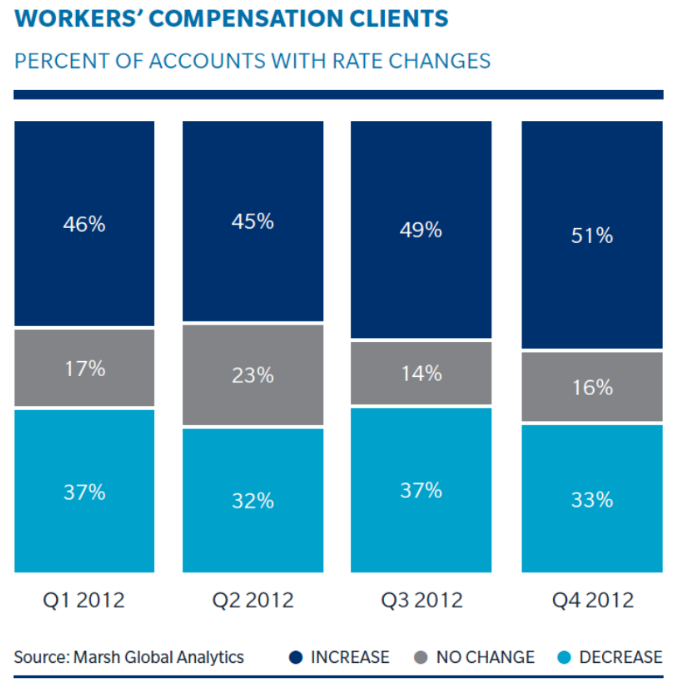
This segment continues to operate at historically unprofitable rates for insurers. Marsh illustrates this with a graphic based on their client accounts.
“Medical expenses as a percentage of toal claims continues to rise, along with the escalation of prescribtion drug use and abuse,” said Zaffino.” Active pre- and post-loss programs, medical cost containment measures and a variety of other technigues help clients manage their claims.
“The largest trend we’re really seeing in casualty is the need to create a comprehensive view of total cost of risk, or TCOR,” said Yoder. “For workers comp, there is much available data, advances in the way insurers calibrate their underwriting and pricing, and a wave of claims-based modeling. Plus, predictive analytics use in claims modeling is accelerating.”
Directors and Officers
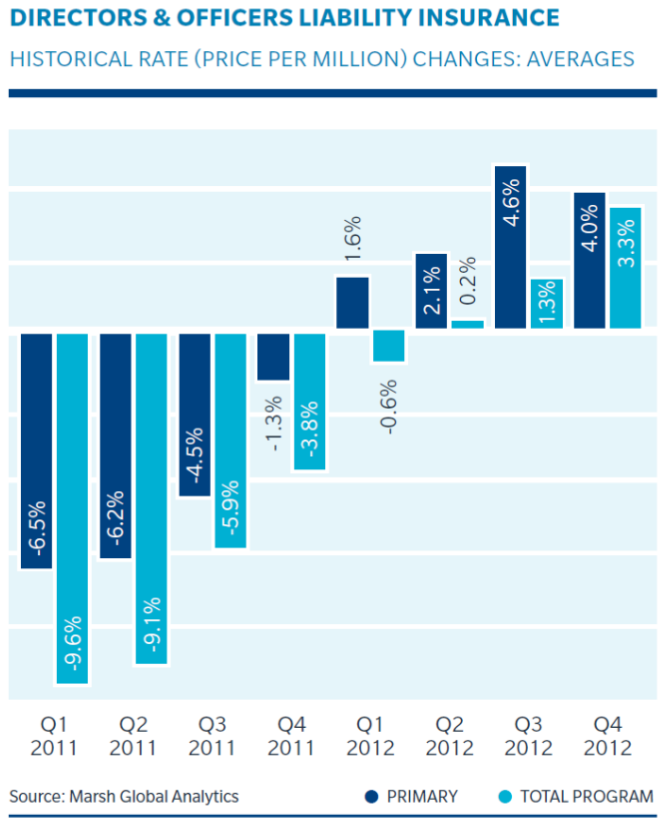
According to Chris Lang, rates in the management liability market are trending upward. As 2012 progressed, leading insueres obtained upwards of 10% increases, and average program rate increases of 5%. “Smaller sized market companies are experiencing higher rate increases than are larger companies,” said Lang. “In 2013, expect insurers’ rate discipline to continue.”
Regulatory actions are increasing. According to NERA, in 2012, settlements rose 6.6% compared with 2011, to 714.


