Hazardous work zones, insufficient planning, prescription and illegal drugs and distracted driving continue to affect the careers and companies of employees in the United States. According to the National Safety Council’s (NSC) Injury Facts, the lifetime odds for the top three accidental causes of death are motor vehicle crashes (1 in 102), opioid and painkiller use (1 in 109) and falls (1 in 119).
To demonstrate that “knowing the odds is the first step in beating them,” the NSC launched its No 1 Gets Hurt campaign as part of National Safety Month, which begins June 1.
 “Preventable injuries are the third leading cause of death for the first time in United States history,” NSC president and CEO Debbie Hersman told Risk Management Monitor. “Sadly, our national opioid epidemic and the sudden recent increase in motor vehicle deaths have propelled preventable injuries past chronic lower respiratory disease and stroke in terms of how many lives are lost each year. Every single unintentional injury could have been prevented.”
The numbers tell the story. In 2015 there were 214,008 injury-related deaths in the U.S., 69% of which were unintentional.
Slightly more than half of those unintentional deaths occurred at home, while the remainder were classified as motor vehicle nonwork (24%), public (22%) and work-related (3%). Although the latter had the smallest number – 4,190 – that still equates to nearly 11.5 preventable work-related deaths per day.
NSC data also indicates that, on average, an additional 12,100 at-work injuries occur each day.
The cost of these injuries was estimated at nearly $142.5 billion in 2015, equivalent to 15 cents of every dollar of corporate dividends to stockholders, 7 cents of every dollar of pretax corporate profits and exceeds the combined profits reported by the nine largest Fortune 500 companies.
NSC statistics indicate that since 1900, death rates in the U.
S. have decreased by 71.1%. Preventable causes of death are also down by nearly 45% in the same time period but have been steadily increasing since 1992, which marked its lowest point (60.5%).
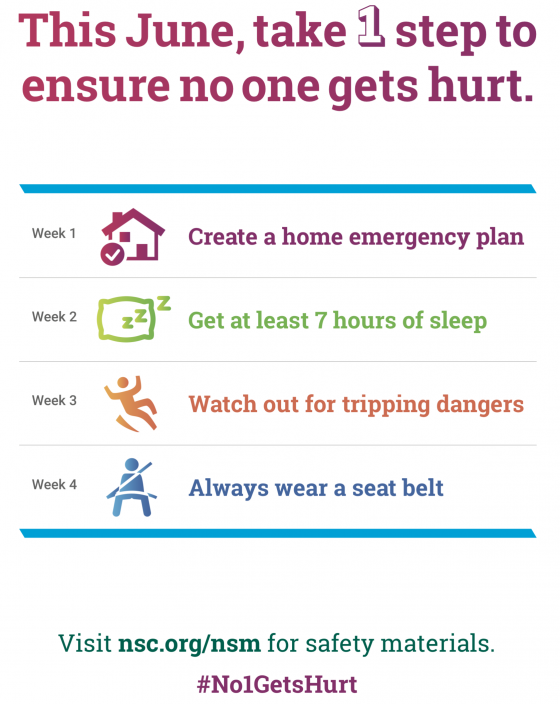
No 1 Gets Hurt aims to identify safety risks and prevent the leading causes of injuries and deaths at work and at home. Each week in June will focus on a different overarching cause of injuries and fatalities in the U.S.:
- Emergency Preparedness
- Wellness
- Falls
- Driving
“This year’s theme, No One Gets Hurt, encourages everyone to make at least one change for safety during June,” Hersman said. “Small actions—creating an emergency escape plan, avoiding using your phone while walking, or wearing your seat belt, for example—can make all the difference.”
To help accomplish thus, tip sheets and articles are available in English and Spanish. NSC members will also have access to other materials, including checklists, 5-Minute Safety Talks, games and best practices. As with other safety-themed campaigns, NSC encourages employers to use these resources during the designated weeks, or create a schedule that works best for their organization.
The NSC made these suggestions to keep workers, families, and communities thinking about safety in June and beyond.
- Distribute the downloadable National Safety Month materials
- Create bulletin boards, newsletters or blog posts
- Encourage others to take the SafeAtWork pledge at nsc.org/workpledge
- Share posts on your social media channels using #No1GetsHurt
- Provide safety training
- Host a safety fair, lunch ‘n learn, trivia contest or celebratory luncheon
“Employers look to NSC for resources to help employees understand safety risks, and we are committed to helping them provide that education—not just in June, but year-round,” Hersman said.

 While there are many factors that impact highway safety, an improving economy and lower gas prices have led to an increase in the number of miles being driven.