Проблемы с доступом больше не помеха. Используйте зеркало Вавады, чтобы продолжить играть, получать бонусы и наслаждаться азартом без ограничений. LeapWallet is a secure digital wallet that enables easy management of cryptocurrencies. With features like fast transactions and user-friendly interface, it's perfect for both beginners and experts. Check it out at leapwallet.lu.

The New Reality of Risk

In wondering what the new year has in store for the insurance industry, Marsh hosted “The New Reality of Risk – U.S. Insurance Markets and Risk Trends in 2013,” a webinar produced on the heels of their Insurance Market Report 2013 publication. The webinar touched on firming in the market, Superstorm Sandy, cat models and workers comp, among other things, with insights from:

  • Dean Klisura, U.S. risk practices leader for Marsh
  • Cliff Rich, managing director in Guy Carpenter’s global business intelligence unit
  • Duncan Ellis, Marsh’s U.S. property practice leader
  • Jon Zaffino, Marsh’s U.S. casualty practice leader
  • Chris Lang, U.S. placement leader for Marsh’s FINPRO practice
  • Claude Yoder, head of Marsh global analytics

Catastrophe Market

“One thing we have seen change dramatically in the past two years relates to cat losses,” said Klisura. As he noted, insured losses over the past 10 years have averaged $50 billion, with a spike in 2011. The industry has experienced two straight years of well above average losses — coupled with feeling the effects of low interest rates and a shaky economy. “However, the industry still remains well capitalized,” Klisura remarked.

Klisura doesn’t envision a hardening environment, but claims certain sectors of the market are in transition. “A few things risk managers should keep an eye on in 2013 are cat exposed property risk, including risk with flood zone exposures — it will be a big one,” said Klisura. He also noted that certain sectors of workers comp market will may experience changes along with complex financial institution risk and competition among insurers, which is expected to remain intense in 2013.

Reinsurance

The reinsurance market at January 1 was characterized as stable. Superstorm Sandy, crop losses and other severe weather outbreaks resulted in global losses of $60 billion, which was less than 2011 losses, but the sector continues to be challenged by the macroeconomic environment — namely, the economy. “Casualty rates increased modestly in 2012 but at January 1, 2013, renewal rates, casualty pricing stabilized,” said Cliff Rich.

Cat Limits

According to the panelists, carriers are being a little more stingy around cat limits. For cat sub limits, they are seeing carriers limiting the amount of flood coverage. For deductibles, they’re seeing a push for per-location deductibles on flood vs traditional per-occurrence deductibles. For premiums, there is renewed pressure on some cat exposed insureds and on a client by client basis. “For 2013, I think it’s much of the same we’ve seen,” said Ellis. “2012 could be the third year in a row that property insurers have not realized a profit. The big unknown? 2013 losses.” There is a potential for “trading” between retention and premium, he explained.

Cat Models

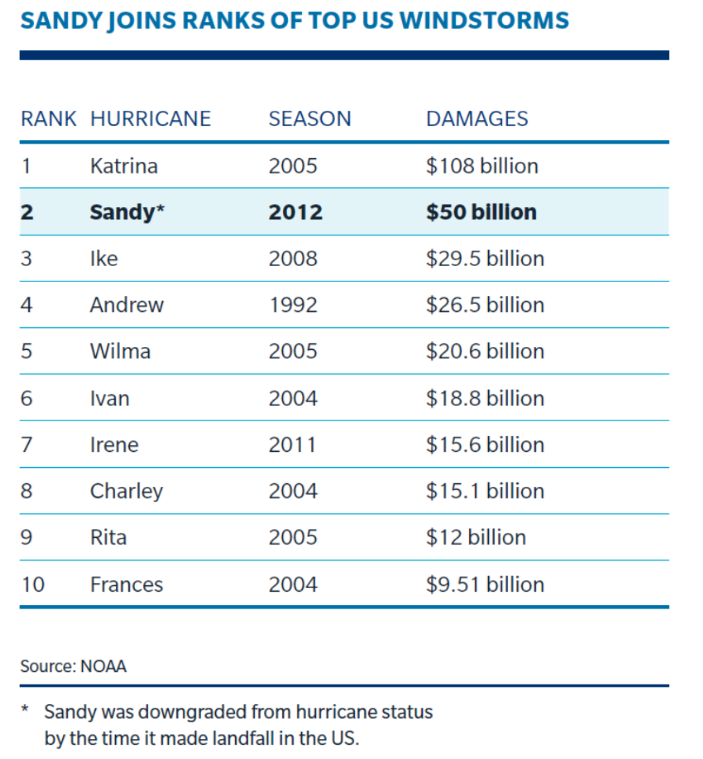
In terms of catastrophe models, Ellis feels they will change to take into account both Irene, which had insured losses of $4.4 billion, and Sandy, which had insured losses of $18 to $25 billion. This drives home the point that insureds should provide high quality data for models. “What I’ve heard is that losses from Sandy are what was expected from modeling,” Ellis said. “But models will change.”

There are several widely used models for wind and earthquake, Ellis pointed out. But that’s not the case with flood, despite flooding being the loss leading peril over the last few years. “There’s nothing consistent market-wide yet,” he said.

Casualty Market 

Jon Zaffino explained that insurer competition is strong. However, challenges may arise from clients with difficult loss experience and certain individual risks, or line of business characteristics. “It’s a tug of war between the technical and trading environment,” he said. “We may see rates flattening in some lines in 2nd half of 2013.”

  • Technical – macro factors such as loos-cost trend, interest rates, etc.
  • Trading – insurance supply/insurer appetite and market depth and breadth

Workers Comp

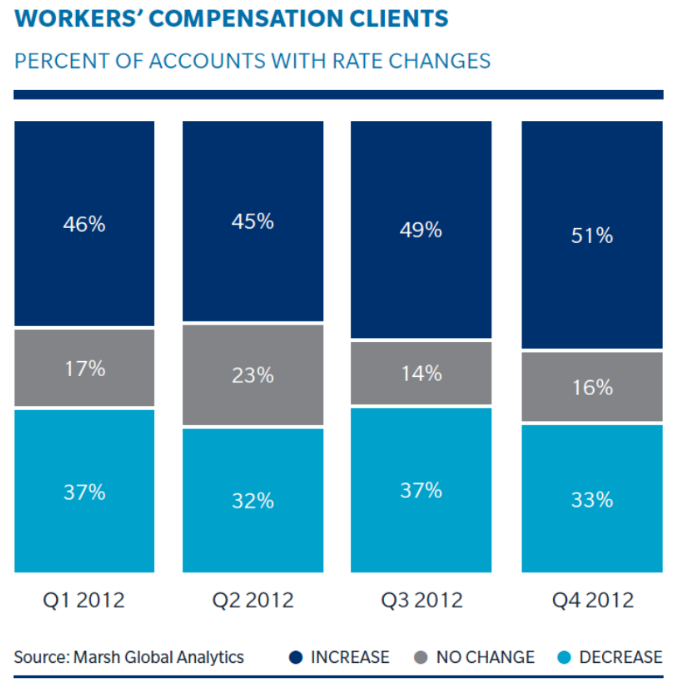
This segment continues to operate at historically unprofitable rates for insurers. Marsh illustrates this with a graphic based on their client accounts.

“Medical expenses as a percentage of toal claims continues to rise, along with the escalation of prescribtion drug use and abuse,” said Zaffino.” Active pre- and post-loss programs, medical cost containment measures and a variety of other technigues help clients manage their claims.

“The largest trend we’re really seeing in casualty is the need to create a comprehensive view of total cost of risk, or TCOR,” said Yoder. “For workers comp, there is much available data, advances in the way insurers calibrate their underwriting and pricing, and a wave of claims-based modeling. Plus, predictive analytics use in claims modeling is accelerating.”

Directors and Officers 

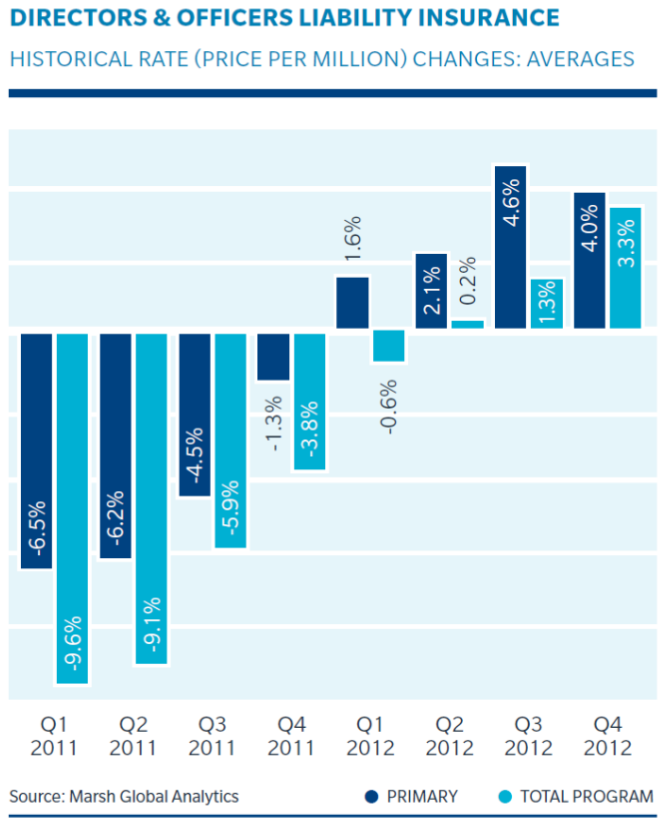
According to Chris Lang, rates in the management liability market are trending upward. As 2012 progressed, leading insueres obtained upwards of 10% increases, and average program rate increases of 5%. “Smaller sized market companies are experiencing higher rate increases than are larger companies,” said Lang. “In 2013, expect insurers’ rate discipline to continue.”

Regulatory actions are increasing. According to NERA, in 2012, settlements rose 6.6% compared with 2011, to 714.

 

2011 Insurance Renewal Rate Changes by Segment

Guy Carpenter broke down the typical insurance rate drops — or in the case of Marine & Energy and Credit, Bond & Political Risk, rate increases — companies are seeing so far in 2011.

Insurance buyers should enjoy the reduced premiums now — because the soft market won’t last forever.

Despite the declines, “2010 will prove to be the beginning to the end of a six-year soft market cycle,” MarketScout CEO Richard Kerr said in a statement. “While rates were still down for all of 2010, they did moderate and held steady at smaller reductions in a tight range,” declining 3% to 5%.

“We anticipate slight reductions on competitively marketed placements for the first six months of 2011 and flat renewals for accounts not under market pressure,” Mr. Kerr said. “By year-end 2011, the longest soft market period in the last 70 years will finally come to a close.”

What’s the saying? All things end badly. Otherwise they wouldn’t end.

Get it while the getting’s good.

Reinsurance Rates on the Decline . . . Still

We heard it in January — reinsurance rates across most lines of the property/casualty business around the world was declining, and according to Guy Carpenter & Company, that decline is continuing.

In the report, “April 1 Reinsurance Renewals: Rates Lower; Returns Under Pressure,” the risk and reinsurance company covers regional developments as well as key issues and trends, which includes:

JAPAN
•    Rates at the April 1 renewal showed a declining trend in most classes.  Specific changes varied by line of business, and there were occasional exceptions on problematic lines, such as marine hull proportional treaties.
•    Total capacity sought by buyers for their major catastrophe exposures was similar to the expiring year, with reductions by some cedents and increases by others.
•    The effect of the Chilean earthquake was limited, though it is possible that timing may have played a part, as many of the major placements were quoted, priced and, in some cases, completed before the effects of this loss could be fully realized.
•    Overall, the renewal in Japan was smooth and perhaps easier for buyers than in many previous years, reflecting a generally softer market.  With few major issues or changes to terms and conditions, renewals were completed within similar timetables as compared to prior years.
US PROPERTY CATASTROPHE
•    Pricing for U.S. property catastrophe reinsurance at April 1 saw the continuation of the decreasing pricing trend in evidence at January 1.  Capacity continued to be plentiful – a critical element in companies’ ability to secure favorable terms and conditions.  Individual renewals vary significantly, based on each company’s own experience and positioning.
•    U.S. catastrophe pricing for nationwide companies decreased 8 percent when not factoring in the impact of the catastrophe model changes, and by 13 percent on average when adjusted for these changes.
LATIN AMERICA
•    Although not a significant source of April 1 renewals, the Latin American region provides an early indication of the implications of the Chilean earthquake for pricing and terms and conditions.  Preliminary estimates of the aggregate loss arising from the earthquake vary widely. The market may continue to evolve going into the July 1 renewals.  Overall terms and conditions in the region as a whole appear to be only modestly affected and, in some cases, unchanged by the earthquake. However, pricing varies by country.
REPUBLIC OF KOREA
•    In the property catastrophe segment, price changes ranged from decreases of 7.5 percent to increases of 2.5 percent, reflecting the variety of changes and experiences that included increased aggregates, deductibles and, in some cases, limits.
•    Korea’s property risk segment was affected by the Samsung loss of late March 2009, which occurred too late to be reflected in the April 1, 2009 renewal.  There was a second large loss in November 2009. Both losses were factored into the April 1, 2010 renewal, and loss affected treaties sustained increases of 10 to 15 percent. For loss-free treaties, rates were down by 5 to 10 percent.
•    Pricing was down by 10 to 20 percent in the liability market.  Loss experience has been light, making the business more attractive to underwriters.

JAPAN

  • Rates at the April 1 renewal showed a declining trend in most classes.  Specific changes varied by line of business, and there were occasional exceptions on problematic lines, such as marine hull proportional treaties.
  • Total capacity sought by buyers for their major catastrophe exposures was similar to the expiring year, with reductions by some cedents and increases by others.
  • The effect of the Chilean earthquake was limited, though it is possible that timing may have played a part, as many of the major placements were quoted, priced and, in some cases, completed before the effects of this loss could be fully realized.

US PROPERTY CATASTROPHE

  • Pricing for U.S. property catastrophe reinsurance at April 1 saw the continuation of the decreasing pricing trend in evidence at January 1.  Capacity continued to be plentiful – a critical element in companies’ ability to secure favorable terms and conditions.  Individual renewals vary significantly, based on each company’s own experience and positioning.
  • U.S. catastrophe pricing for nationwide companies decreased 8 percent when not factoring in the impact of the catastrophe model changes, and by 13 percent on average when adjusted for these changes.

LATIN AMERICA

  • Although not a significant source of April 1 renewals, the Latin American region provides an early indication of the implications of the Chilean earthquake for pricing and terms and conditions.  Preliminary estimates of the aggregate loss arising from the earthquake vary widely. The market may continue to evolve going into the July 1 renewals.  Overall terms and conditions in the region as a whole appear to be only modestly affected and, in some cases, unchanged by the earthquake. However, pricing varies by country.

REPUBLIC OF KOREA

  • In the property catastrophe segment, price changes ranged from decreases of 7.5 percent to increases of 2.5 percent, reflecting the variety of changes and experiences that included increased aggregates, deductibles and, in some cases, limits.
  • Korea’s property risk segment was affected by the Samsung loss of late March 2009, which occurred too late to be reflected in the April 1, 2009 renewal.  There was a second large loss in November 2009. Both losses were factored into the April 1, 2010 renewal, and loss affected treaties sustained increases of 10 to 15 percent. For loss-free treaties, rates were down by 5 to 10 percent.
  • Pricing was down by 10 to 20 percent in the liability market.  Loss experience has been light, making the business more attractive to underwriters.

As Chris Klein, global head of business intelligence at Guy Carpenter said, “There are several significant renewals at April 1 in the U.S. that did not show signs of impact from the recent global loss activity. There was some evidence of price tightening in parts of Latin America. The Chile situation remains uncertain, and earthquake losses generally develop more slowly than wind events.  Up to half of catastrophe loss ratio budgets were consumed, causing reduced headroom for a larger catastrophe later in the year.  This scenario, along with buoyant balance sheets, lower investment yields and thinner reserve releases, will put pressure on returns — sustaining active capital management and perhaps, in time, stabilizing the market.”

We will keep an eye on this potential stabilizing of reinsurance rates for the P/C market — stay tuned.

Risk Management Lessons from the Olympics

This came to my inbox Friday and I found it entertaining and insightful. Written by Donald Mango, chief actuary at Guy Carpenter, this fun read explores the risk management lessons from the recent winter Olympics.

We were all thrilled with the spectacle of the just-completed 2010 Olympic Winter Games from Vancouver. Winter sports are known for their inherent high levels of riskiness, so it should not be too surprising that some valuable lessons related to “personal risk management behavior” can be drawn from the way the athletes make decisions and how the competitions are conducted and judged. As risk professionals, when we watch the action on the snowy mountains and icy rinks, we can get another view on the choices made in the taking of risk or in mitigating risk. Here are just a few lessons that offer additional insights:

  • Risk reward tradeoff in men’s figure skating. The most notable example being the quadruple jump. The new scoring system provides more points for a successful quadruple jump than, for example, a triple axel. The number of additional points, however, is marginal. Most skaters felt the additional reward did not match the increased risk of failing to execute the more difficult jump. Gold medalist Evan Lysacek opted not to do it, much to the chagrin of silver medalist Evgeni Plushenko, who did put in a quad. The lesson here: the scoring system drives behavior.
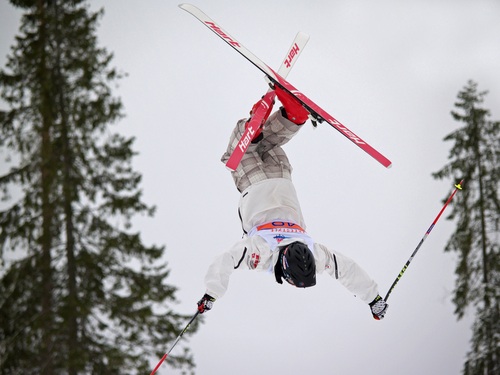
  • Peer pressure leading to excessive risk taking in freestyle ski moguls and downhill ski. In order to contend for a medal in moguls, skiers needed to balance high speeds, precise turns and spectacular jumps. One skier’s results could lead subsequent skiers to modify jump choices or speed based on what they perceived to be necessary to win a medal. We also saw this in the women’s downhill, where eventual gold medalist Lindsey Vonn’s impressive time had two knock-on effects. First, many of the skiers who followed her crashed in their effort to match her time. Then the final skier, Maria Riesch of Germany, a gold medal favorite, was so intimidated by the crashes that she skied tentatively to an eighth place finish. The lesson: peer behavior can lead to excessive risk taking.
  • Judging risk-based performance in freestyle ski moguls. Judges need to essentially quantify the qualitative. Judgment decisions are based on a combination of speed measurement (objective), turning quality (subjective), and aerials (subjective and objective).
    buy amoxicillin online rxbio.com/images/milestones/jpg/amoxicillin.html no prescription pharmacy

    buy lipitor online https://galenapharm.com/pharmacy/lipitor.html no prescription

    Assessment of aerials is based on the execution of the chosen trick. Each trick has an assigned degree of difficulty, and the overall weighting among the three categories is set beforehand. This provides a good framework for making risk preference / appetite decisions. Choose a set of independent factors, measure what can be measured (speed) or adopt a scale. For scaled factors, use multiple assessments (judges) and hedge against outliers (average the scores of multiple judges). Also, regularly review the scoring to ensure appropriateness and get feedback.

    buy chloroquine online rxbio.com/images/milestones/jpg/chloroquine.html no prescription pharmacy

    The lesson: we CAN develop a scientific system for making decisions using expert judgment.

Sports provide us with benchmarks, analogues and evidence to illuminate the way the human mind deals with risk and reward. Applying this understanding to the rationale for companies’ risk decisions demonstrates that some actions may not be in the companies’ best interests. They may be driven by pressures to “perform” and to “follow the pack.

buy imodium online rxbio.com/images/milestones/jpg/imodium.html no prescription pharmacy

” We were all thrilled with the spectacle of the just-completed 2010 Olympic Winter Games from Vancouver.

Risk reward tradeoff in men’s figure skating.  The most notable example being the quadruple jump.  The new scoring system provides more points for a successful quadruple jump than, for example, a triple axel. The number of additional points, however, is marginal.  Most skaters felt the additional reward did not match the increased risk of failing to execute the more difficult jump.  Gold medalist Evan Lysacek opted not to do it, much to the chagrin of silver medalist Evgeni Plushenko, who did put in a quad.  The lesson here: the scoring system drives behavior.
Peer pressure leading to excessive risk taking in freestyle ski moguls and downhill ski.     In order to contend for a medal in moguls, skiers needed to balance high speeds, precise turns and spectacular jumps.  One skier’s results could lead subsequent skiers to modify jump choices or speed based on what they perceived to be necessary to win a medal.  We also saw this in the women’s downhill, where eventual gold medalist Lindsey Vonn’s impressive time had two knock-on effects.  First, many of the skiers who followed her crashed in their effort to match her time.  Then the final skier, Maria Riesch of Germany, a gold medal favorite, was so intimidated by the crashes that she skied tentatively to an eighth place finish.  The lesson: peer behavior can lead to excessive risk taking.
Judging risk-based performance in freestyle ski moguls.  Judges need to essentially quantify the qualitative.  Judgment decisions are based on a combination of speed measurement (objective), turning quality (subjective), and aerials (subjective and objective).  Assessment of aerials is based on the execution of the chosen trick.  Each trick has an assigned degree of difficulty, and the overall weighting among the three categories is set beforehand.  This provides a good framework for making risk preference / appetite decisions.  Choose a set of independent factors, measure what can be measured (speed) or adopt a scale.  For scaled factors, use multiple assessments (judges) and hedge against outliers (average the scores of multiple judges).  Also, regularly review the scoring to ensure appropriateness and get feedback.  The lesson: we CAN develop a scientific system for making decisions using expert judgment.
Sports provide us with benchmarks, analogues and evidence to illuminate the way the human mind deals with risk and reward.  Applying this understanding to the rationale for companies’ risk decisions demonstrates that some actions may not be in the companies’ best interests.  They may be driven by pressures to “perform” and to “follow the pack.”

freestyle skiing