Для тех, кто интересуется безопасным доступом к онлайн-играм, наш партнер предлагает зеркало Вавады, которое позволяет обходить любые блокировки и сохранять доступ ко всем функциям казино.

October 2015 the Warmest Ever Recorded

It isn’t just your imagination: October 2015 was the warmest on record worldwide, and saw the greatest above-average deviation for any month. According to the National Oceanic and Atmospheric Administration, the average temperature across global land and ocean surfaces was 1.

buy zantac online healthymomsandbabes.org/wp-content/uploads/2023/10/jpg/zantac.html no prescription pharmacy

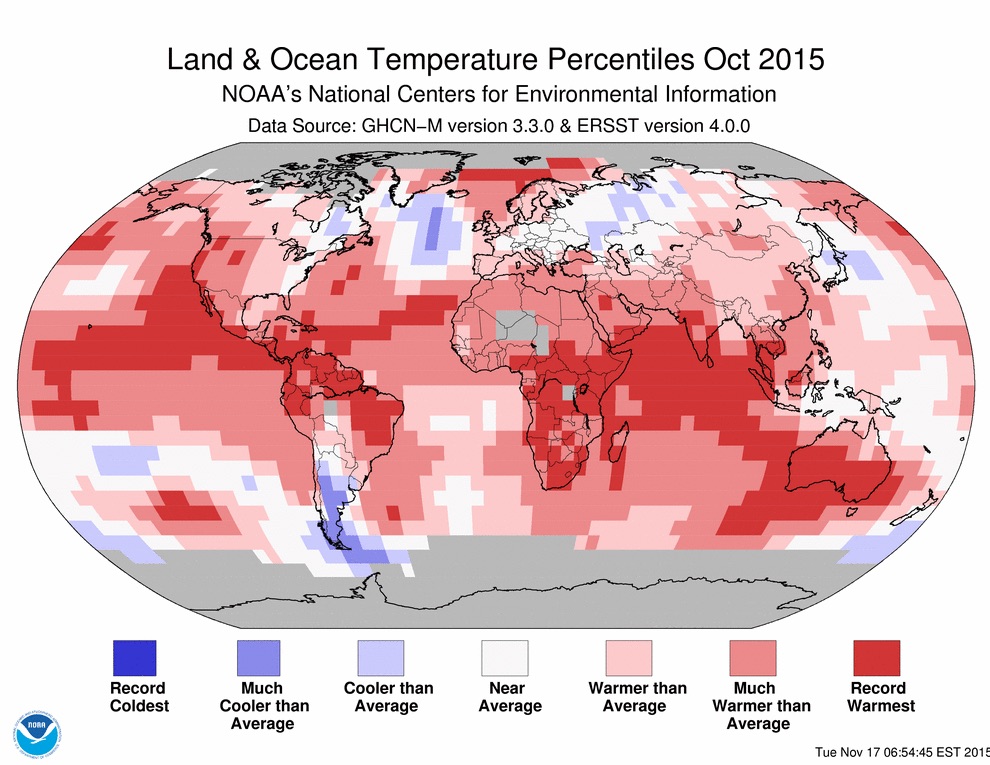
76 °F above the 20th century average, surpassing the previous record set last year by 0.36 °F. The globally-averaged land surface temperature was 2.39°F above the 20th century average—the highest for October in 136 years of NOAA records.

buy mobic online healthymomsandbabes.org/wp-content/uploads/2023/10/jpg/mobic.html no prescription pharmacy

NOAA land and ocean temp percentiles

October was also the warmest month ever compared to average, out of a total of 1,630 months. What’s more, NOAA reports, eight of the first 10 months of the year have been record warm for their respective months—also a record number of broken records. Globally-averaged land surface and sea surface temperatures have been 1.55 °F and 2.30 °F above average, respectively, surpassing all previous records. With many months setting record high temperatures by unprecedented margins, NOAA said in August that there was a 97% chance that 2015 would secure the title of the warmest year on record, and it remains solidly on track.

In early November, the Met Office, Britain’s national weather service, and NASA both reported that the Earth’s average temperature is likely to rise 1 °C above pre-industrial levels for the first time by the end of 2015. This milestone is significant since it marks the halfway point to two degrees Celsius, the internationally accepted limit for avoiding the worst consequences of climate change, the Washington Post reported. Since 2000, global monthly heat records have been broken 32 times, yet the last time a monthly cold record was set was in 1916, according to CBS News.

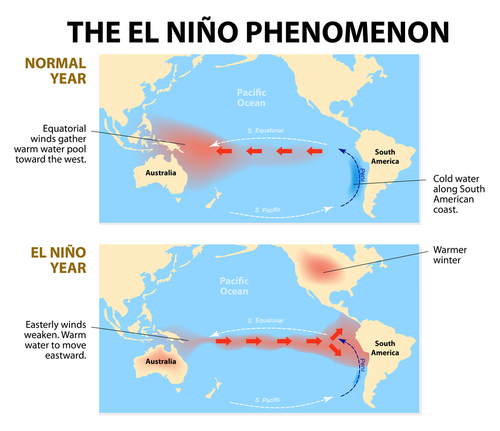
Some of the heat is likely due to a strong El Nino event in the Eastern Pacific that continues to gather strength.

buy zocor online healthymomsandbabes.org/wp-content/uploads/2023/10/jpg/zocor.html no prescription pharmacy

This year’s El Nino is already one of the three strongest ever seen, CNN reports, but cannot account for all of the year’s warmth, as 13 of the 15 warmest years on record have occurred since 2000. Rather, it is the combination of long-term warming and the strong El Nino pushing Earth toward its second consecutive warmest year on record.

According to Aon Benfield’s October 2015 Catastrophe Report, there were three billion-dollar weather-related disasters in October: flooding in South Carolina with economic losses of at least $2 billion, $4.2 billion in damage from Typhoon Mujigae in China, and $1 billion in damage from flash flooding in France. The firm estimates worldwide economic losses from October to total more than $10 billion. There have been 21 billion-dollar weather events through October 2015, Aon reported, on pace for a lower total than the annual average of 28.

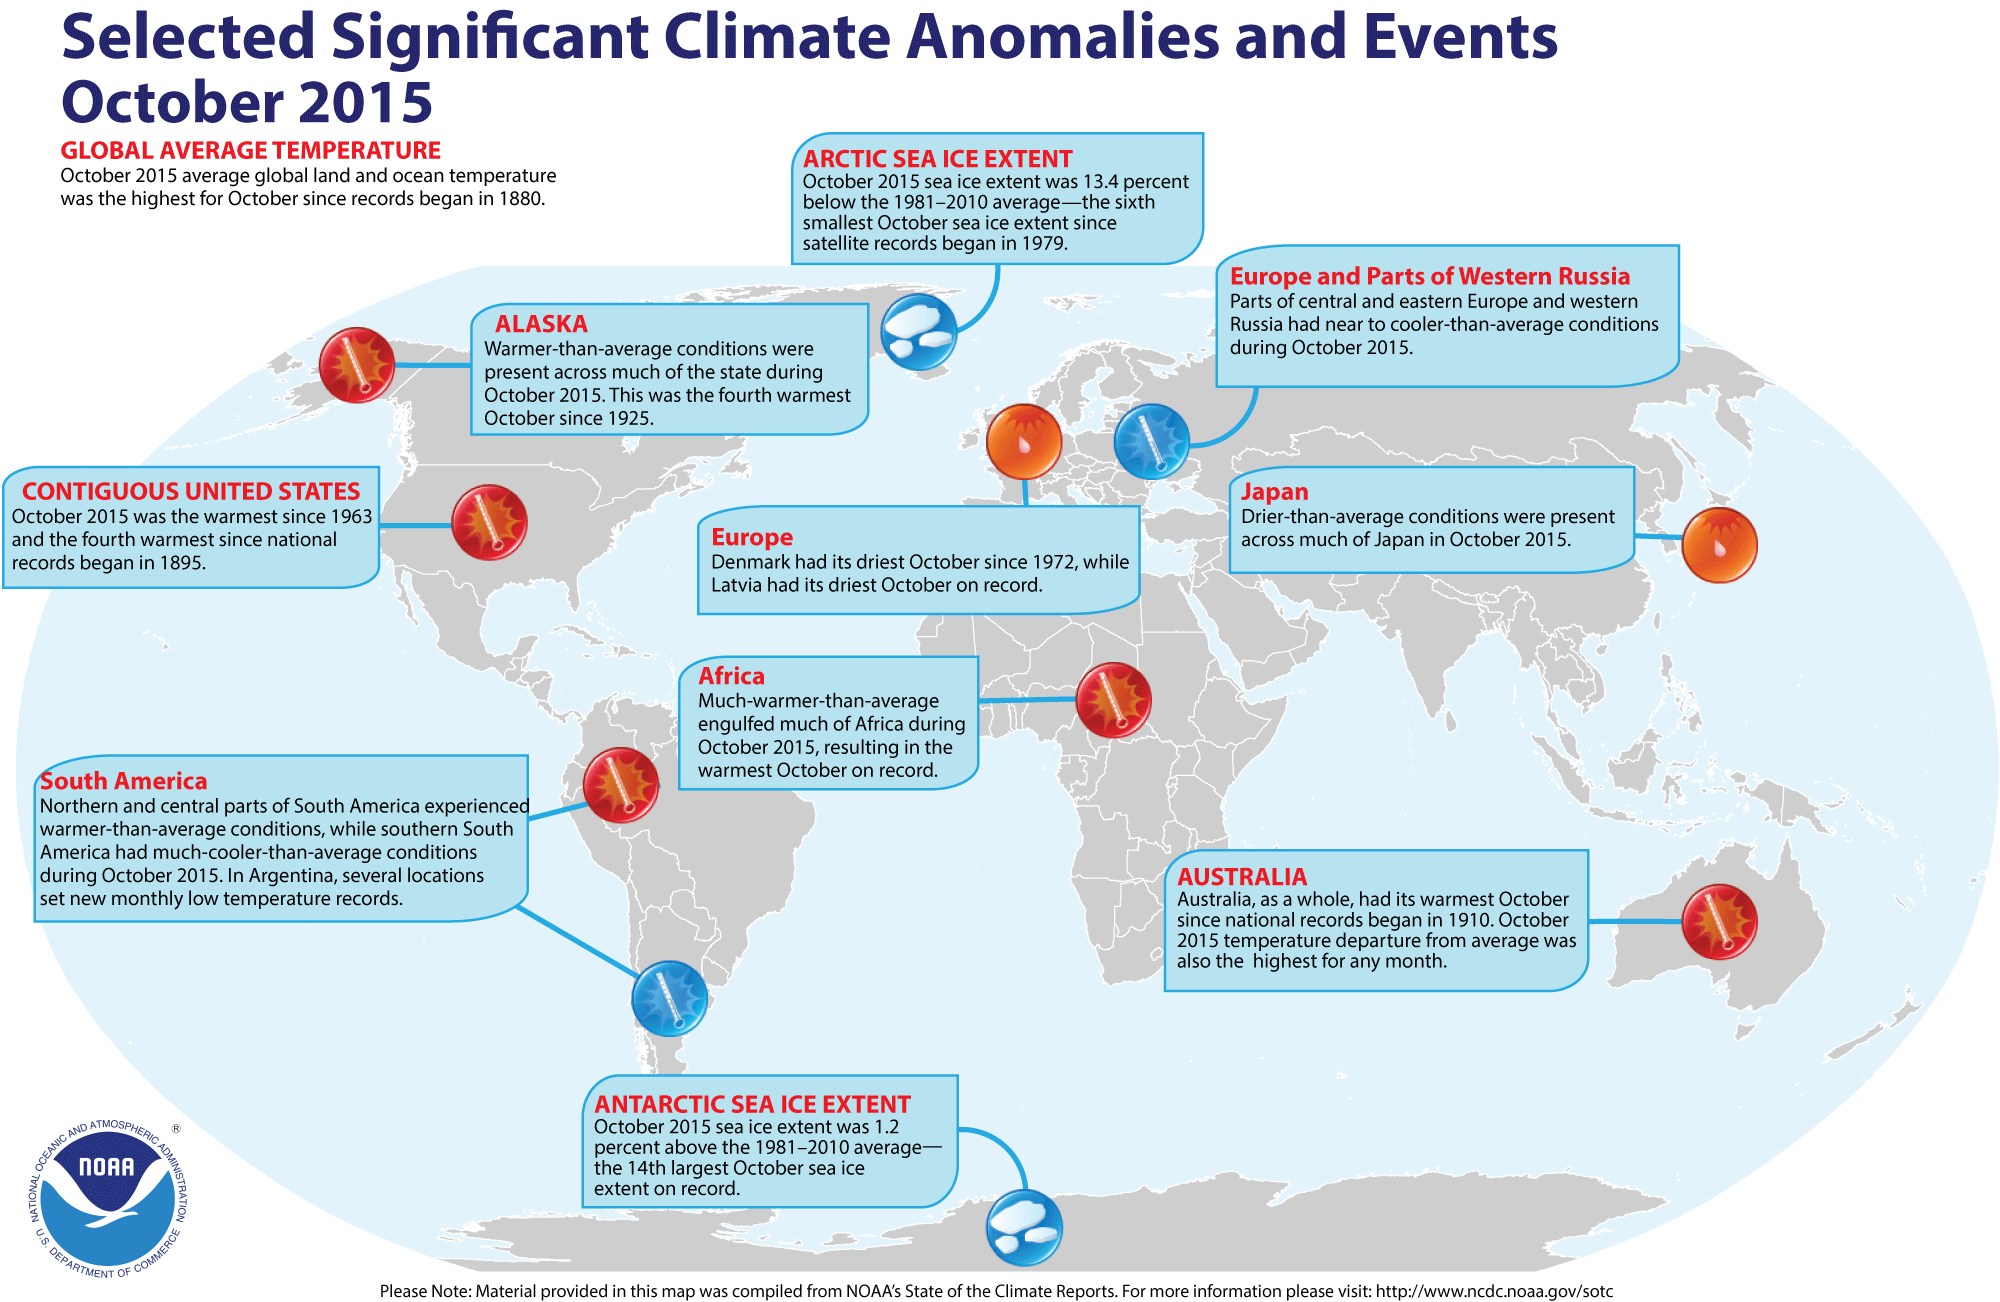
Check out the infographic below for more of the major climate anomalies and events from October 2015:

NOAA october climate anomalies

New Climate Change Report Highlights Risk Management Strategies

Global Warming

This week, a new report from the United Nations’ Intergovernmental Panel on Climate Change summarized the ways climate change is already impacting individuals and ecosystems worldwide and strongly cautioned that conditions are getting worse. Focusing on impacts, adaptation and vulnerability, the panel’s latest work offers insight on economic loss and prospective supply chain interruptions that should be of particular note for risk managers—and repeatedly highlights principles of the discipline as critical approaches going forward.

Key risks the report identified with high confidence, span sectors and regions include:

i. Risk of death, injury, ill-health, or disrupted livelihoods in low-lying coastal zones and small island developing states and other small islands, due to storm surges, coastal flooding, and sea-level rise.

ii. Risk of severe ill-health and disrupted livelihoods for large urban populations due to inland flooding in some regions.

iii. Systemic risks due to extreme weather events leading to breakdown of infrastructure networks and critical services such as electricity, water supply, and health and emergency services.

iv. Risk of mortality and morbidity during periods of extreme heat, particularly for vulnerable urban populations and those working outdoors in urban or rural areas.

v. Risk of food insecurity and the breakdown of food systems linked to warming, drought, flooding, and precipitation variability and extremes, particularly for poorer populations in urban and rural settings.

vi. Risk of loss of rural livelihoods and income due to insufficient access to drinking and irrigation water and reduced agricultural productivity, particularly for farmers and pastoralists with minimal capital in semi-arid regions.

vii. Risk of loss of marine and coastal ecosystems, biodiversity, and the ecosystem goods, functions, and services they provide for coastal livelihoods, especially for fishing communities in the tropics and the Arctic.

viii. Risk of loss of terrestrial and inland water ecosystems, biodiversity, and the ecosystem goods, functions, and services they provide for livelihoods.

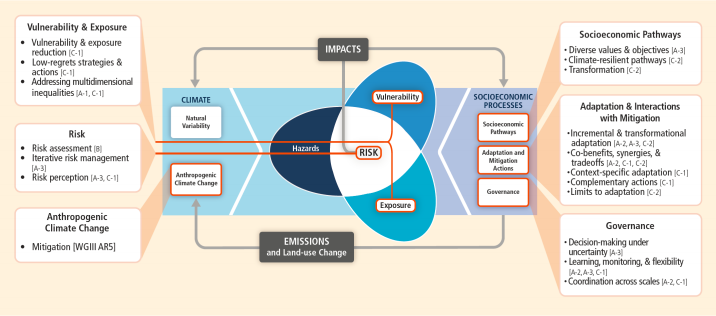
The report highlights more sector-specific risks, and one table even highlight the panel’s perception of the role of risk management in the future of climate change policy and planning:

IPCC Chart

On the whole, the report lays out many familiar risk management approaches and how they can be best applied to evaluating the risks of climate change and how to mitigate them. Perhaps the environment is warming to risk-informed decision-making as well.

New Forecasting Method Predicts 75% Chance of El Nino in 2014

There is a 75% chance of an El Niño event in 2014, according to an early warning report published in Proceedings of the National Academy of Sciences (PNAS). The researchers used a new method that uses network analysis to predict weather systems up to a year ahead, instead of the usual six-month maximum of other approaches. The model successfully predicted the absence of El Niño in 2012 and 2013.

El Niño events are characterized by a warmer Pacific Ocean, which results in a disruption to the ocean-atmosphere system. This can lead to warmer temperatures worldwide, droughts in Australia and Southeast Asia, and heavy rain and flooding in parts of the U.S. and South America. If such an event occurred toward the end of 2014, the increased temperatures and drought conditions could persist through 2015.

The researchers suggested that their work might help farmers and government agencies by giving them more time to prepare and to consider investing in flood- or drought-resistant crops.

“Farmers might find it worthwhile to invest in drought- or flood-resistant varieties of crops,” Josef Ludescher and Armin Bunde told Businessweek. “A strong El Niño event in late 2014 can make 2015 a record year for global temperatures.”

The current highest record global temperatures date back to 1998, during the last strong El Niño. Given the continued increases in baseline temperature around the world, an El Niño event this year could lead to the record-breaking heat.

Last week, the U.S. Climate Prediction Center issued a similar warning. While the forecasters expect neutral conditions through the spring, a change in temperatures may “portend warming in the coming months.

El Nino Phenomenon