Игроки всегда ценят удобный и стабильный доступ к играм. Для этого идеально подходит зеркало Вавады, которое позволяет обходить любые ограничения, обеспечивая доступ ко всем бонусам и слотам.

Quantifying Supply Chain Risk

Today, more businesses around the world depend on efficient and resilient global supply chains to drive performance and achieve ongoing success. By quantifying where and how value is generated along the supply chain and overlaying of the array of risks that might cause the most significant disruptions, risk managers will help their businesses determine how to deploy mitigation resources in ways that will deliver the most return in strengthening the resiliency of their supply chains. At the same time, they will gain needed insights to make critical decisions on risk transfer and insurance solutions to protect their companies against the financial consequences of potential disruptions.

As businesses evaluate their supply chain risk and develop strategies for managing it, they might consider using a quantification framework, which can be adapted to any traditional or emerging risk.

  • Begin with a “bricks and mortar” risk assessment. Start with the traditional property business interruption risk, focusing first on exposures related to your company’s owned physical plants and facilities as well as those of critical trading partners.
  • Understand and analyze your global business model, as well as any changes that have been implemented to create efficiencies or as a result of mergers, acquisitions or divestitures. Determine exactly how and where value is created and use this information to identify and assess potential vulnerabilities.
  • Distinguish between volume and value. You may have significant trade volume in dollar terms with one partner that can be easily replaced while the dollar volume of trade with a supplier of a critical raw material, component or ingredient may be small, but difficult and costly to replace.  In this case, the supplier with the least spend could be the one that has the most impact if disrupted.
  • Tie financial impacts to risk of disruption. This will enable your company to establish priorities and allocate resources in dealing with potential exposures.
  • Beginning with your most significant potential exposures, understand what mitigation options are available and compare them to what you already have in place.
  • Quantify your worst-case exposures in terms of maximum foreseeable losses.
  • Know your company’s ability to respond to events and threats, especially those that might affect the most critical elements of your supply chain. Identify specific emerging risks that are likely to have the greatest potential financial consequences, such as: cyber network interruption; political and expropriation risk; infectious disease and pandemic; product liability and recall, as well as other potential exposures.
  • In evaluating various supply chain exposures, leverage findings from the traditional business interruption study conducted earlier in the process. This can help determine how other risks might affect specific operations and individual trading partners and, in turn, cause disruptions along the supply chain. Remember, all business interruption risk resides on your company’s P&L and within your unique business model, regardless of cause.
  • Revisit your business continuity, incident response and crisis management plans in the context of the wider range of potential risks confronting your supply chain and individual trading partners.
  • Quantify worst-case financial exposures.  This will give you the ability to pinpoint how and where to allocate resources to mitigate exposures as well as to set priorities with respect to your risk transfer decisions, including coverages purchased, limits and optimal program structure.

U.S. Rates Continue Holding Pattern

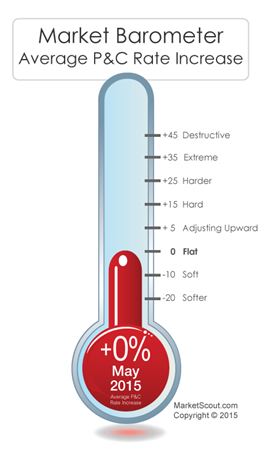
Insurance renewals in May showed premiums in the U.S. to be steady except when there were changes in the exposure base, according to MarketWatch. Rates are stable and most commercial accounts are securing renewal terms as they expire.

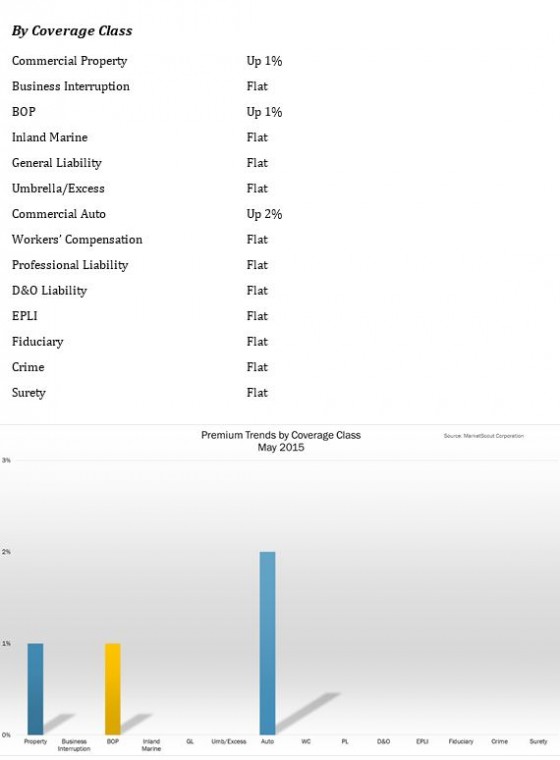
“A lot of business renewed in May 2015. Overall, rates largely continue in a holding pattern. It seems both insureds and insurers are content to move forward with little to no changes,” Richard Kerr, CEO of MarketScout said in a statement. “The only notable exception is transportation where the auto portion of these accounts is driving an average 2% increase.”

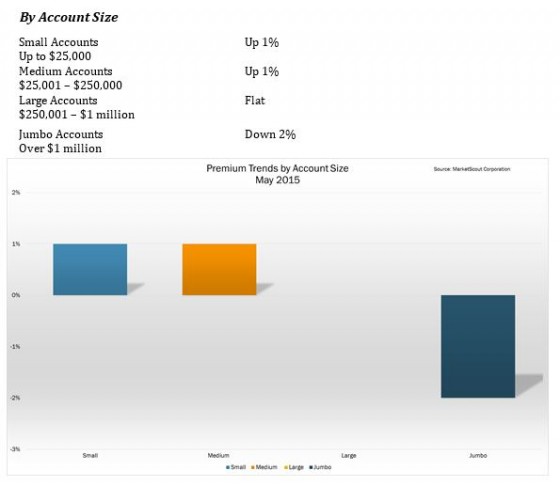
Business Owners Policies (BOP) were up from flat to plus 1% in May as compared to April 2015. EPLI coverage was down from plus 1% to flat, or 0% increase, MatketWatch said. By account size, rates matched April. Jumbo accounts (more than $1 million premium) continue to show the greatest reductions at minus 2%. Small (up to $25,000 premium) and medium ($25,001 to $250,000 premium) accounts were up 1%.

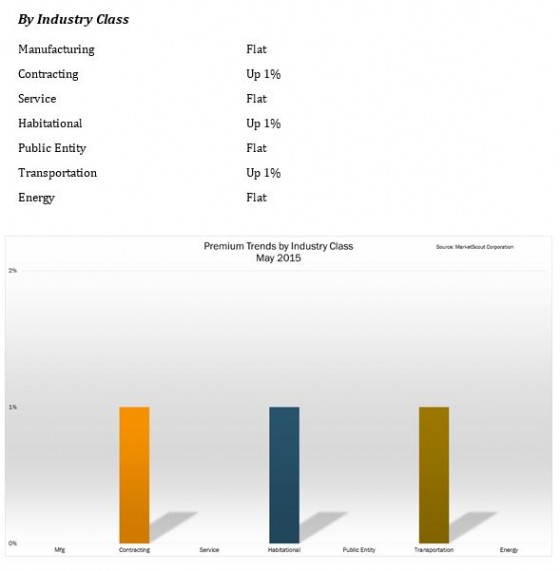
Contracting was the only industry classification to change from April to May 2015. Contracting was up 1%.

MarketScout, an insurance distribution and underwriting company headquartered in Dallas, compiles the Commercial and Personal Lines Market Barometers. The firm owns and operates the MarketScout Exchange at marketscout.com as well as more than 40 other online and traditional underwriting and distribution venues.

The National Alliance for Insurance Education and Research conducted pricing surveys used in MarketScout’s analysis of market conditions.

May 2015 rates by coverage, account size and industry class:


What to Do About Reputation Risk

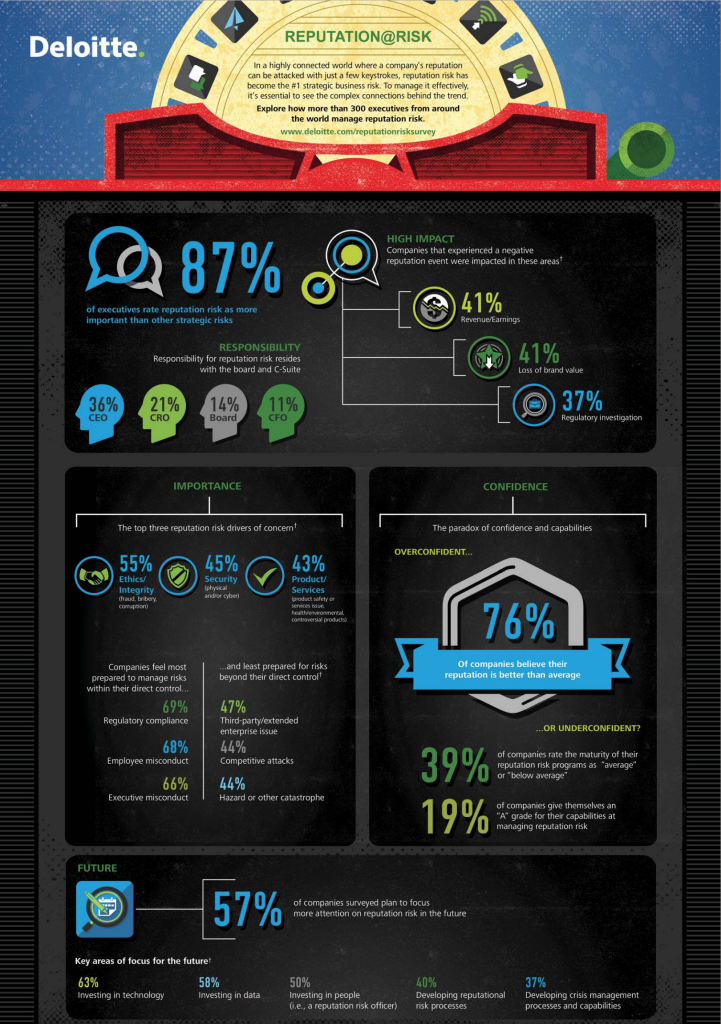
Of executives surveyed, 87% rate reputation risk as either more important or much more important than any other strategic risks their companies face, according to a new study from Forbes Insights and Deloitte Touche Tohmatsu Limited. Further, 88% say their companies are explicitly focusing on managing reputation risk.

Yet a bevy of factors contribute to reputation risk, making monitoring and mitigating the dangers seem particularly unwieldy. These include business decisions and performance in the following areas:

Financial performance: Shareholders, investors, lenders, and many other stakeholders consider financial performance when assessing a firm’s reputation.

Quality: An organization’s willingness to adhere to quality standards goes a long way to enhancing its reputation. Product defects and recalls have an adverse impact.

Innovation: Firms that differentiate themselves from their competitors through innovative processes and unique/niche products tend to have strong name recognition and high reputation value.

Ethics and integrity: Firms with strong ethical policies are more trustworthy in the eyes of stakeholders.

Crisis response: Stakeholders keep a close eye on how a company responds to difficult situations. Any action during a crisis can ultimately affect the company’s reputation.

Safety: Strong safety policies affirm that safety and risk management are top strategic priorities for the company, building trust, and value creation.

Corporate social responsibility: Actively promoting sound environmental management and social responsibility programs helps create a reputation “safety net” that reduces risk.

Security: Strong infrastructure to defend against physical and cybersecurity threats helps avoid security breaches that could damage a company’s reputation.

But brand crises make headlines with increasing frequency, and companies are laying responsibility at the feet of the C-suite, particularly chief risk officers. Deloitte reports that respondents considered the primary responsibility to rest with: the chief executive officer (36%), chief risk officer (21%), board of directors (14%), or chief financial officer (11%).

What can they do? The study offered these key points to consider when crafting a crisis management plan:

  • Don’t wait until a crisis hits to get ready. Monitoring, preparation and rehearsal are the most effective ways to get ready for a crisis event. Organizations that can plan and rehearse potential crisis scenarios should be better positioned to respond effectively when a crisis actually hits.
  • Every decision during a major crisis can affect stakeholder value. Reputation risks destroy value more quickly than operational risks.
  • Response times should be in minutes, not hours or days. Teams on the ground need to take control, lead with flexibility, make decisions with less-than-perfect information, communicate well internally and externally, and inspire confidence. This often requires outside-the-box thinking and innovation.
  • You can emerge stronger. Almost every crisis creates opportunities for companies to rebound. However, those opportunities will surface only if you’re looking for them.
  • When a crisis seems like it’s over, it’s not. The work goes on long after you breathe a sigh of relief. The way you capture and manage data, log decisions, manage finances, handle insurance claims, and meet legal requirements on the road back to normality can determine how strongly you recover.

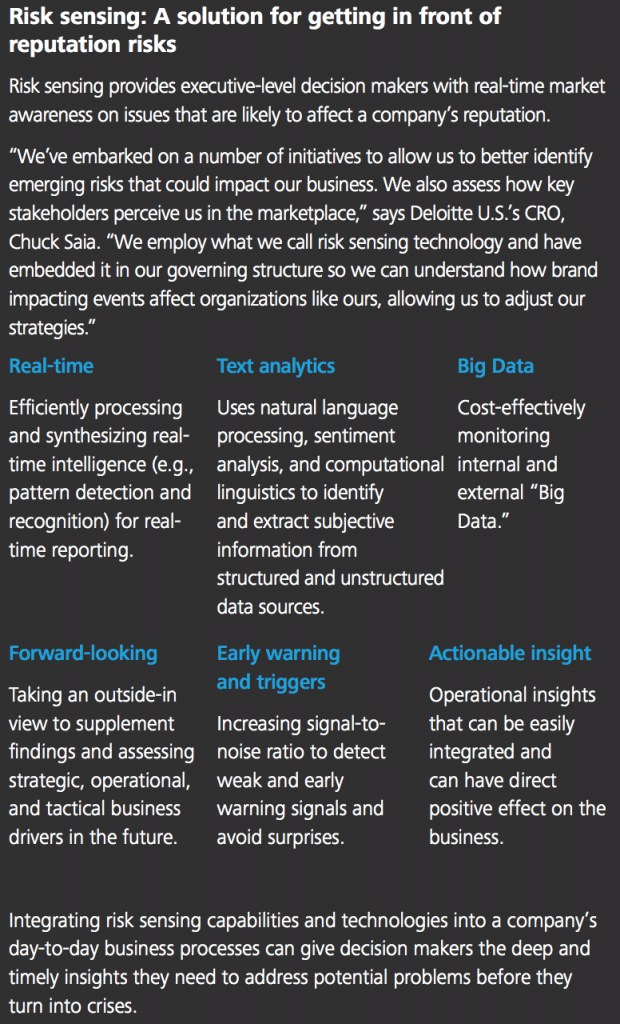
But the real objective should be preventing these potential crises to begin with. Deloitte recommends exploring the possibilities of “risk sensing” – using real-time data to monitor the issues that might impact a company’s reputation:

Crisis management for C-suite executives

Check out the infographic below for more insights from the Deloitte Reputation@Risk survey:

Deloitte Reputation@Risk Global Survey

Quest Data Shows Rise in Positive Test Rates for Workplace Illicit Drugs

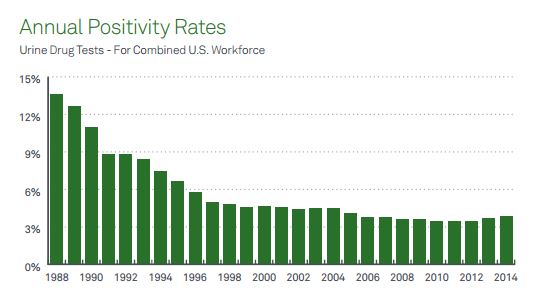
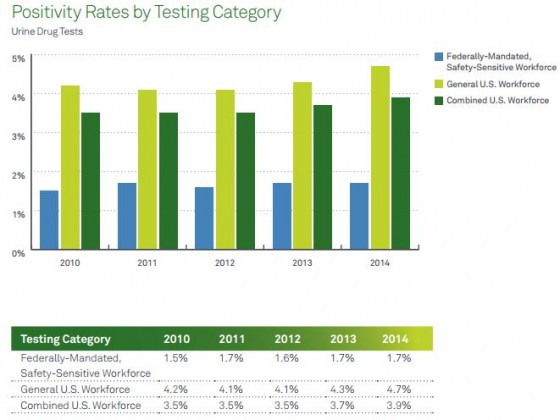
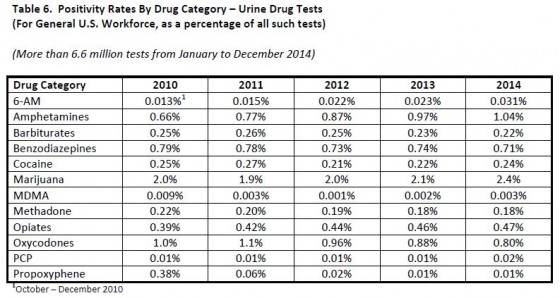
Organizations in the United States that tested employees for drugs saw a 9.3% jump in the number of positive drug tests for illicit drugs in the general workforce, to 4.7% in 2014 from 4.3% in 2013, according to data from Quest Diagnostics. These results may mark a rising trend, as 2013 was the first year since 2003 in which the overall positivity rate for about 1.1 million tests increased in the general U.S. workforce. The analysis shows a potential reversal of a decades-long decline in the abuse of illicit drugs in the U.S. workforce, Quest said.

“American workers are increasingly testing positive for workforce drug use across almost all workforce categories and drug test specimen types. In the past, we have noted increases in prescription drug positivity rates, but now it seems illicit drug use may be on the rise, according to our data,” Dr. Barry Sample, director of science and technology at Quest Diagnostics Employer Solutions, said in a statement.

buy seroquel online azimsolutions.com/wp-content/uploads/2023/10/jpg/seroquel.html no prescription pharmacy

“These findings are especially concerning because they suggest that the recent focus on illicit marijuana use may be too narrow, and that other dangerous drugs are potentially making a comeback.”

While marijuana continues to be the most commonly detected illicit drug, others include cocaine, methamphetamine and heroin, Quest reported, noting that across all specimen types, the positivity rate for amphetamines is now at the highest levels on record and the positivity rate for methamphetamine is at its highest level since 2007. Amphetamines make up the category that includes both prescription amphetamine drugs like Adderall as well as methamphetamine. The positivity rate for 6-acetylmorphine, or 6-AM, a specific marker for heroin, doubled in the general U.S. workforce between 2011 and 2014, According to Quest.

In urine drug test data from two states with recreational marijuana-use laws, Colorado and Washington, the marijuana positivity rate increased 14% and 16%, respectively, in the general U.S. workforce between 2013 and 2014. This roughly paralleled the national average of 14.

buy vibramycin online azimsolutions.com/wp-content/uploads/2023/10/jpg/vibramycin.html no prescription pharmacy

3%. By comparison, between 2012 and 2013, the marijuana positivity rate increased 20% and 23% in Colorado and Washington, respectively, compared to the national average of 5%, Quest said.

“We were surprised that marijuana positivity increased at about the same rate in Colorado and Washington as the rest of the United States in 2014, particularly given the sharp increases in the marijuana positivity rate in both of these states in the prior year,” Dr. Sample said. “It’s unclear if this data suggest a leveling off in marijuana use in these particular states or if some other factor is at work. We also find it notable that the national marijuana positivity rate increased as much as it did in 2014, and question if this means that people are more accepting and therefore more likely to use marijuana recreationally or for therapeutic purposes than in the past even in states where marijuana’s use is not clearly sanctioned by state laws. This will be an important area of continued analysis given the national debate about the legality and health impacts of recreational and medicinal marijuana use.”