Игроки всегда ценят удобный и стабильный доступ к играм. Для этого идеально подходит зеркало Вавады, которое позволяет обходить любые ограничения, обеспечивая доступ ко всем бонусам и слотам.

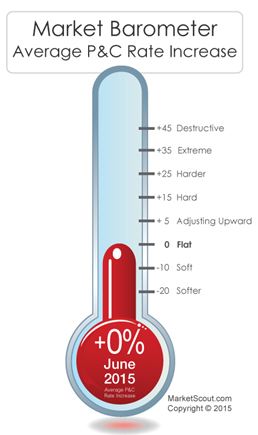
P&C Rates Remain Flat

The property and casualty insurance market remained flat through the first four months of this year, with many large P&C insurers holding a steady line, as rates, for the most part, have remained unchanged, according to MarketScout.

“We are in the insurance doldrums. There really isn’t even a breeze of significant movement anywhere,” Richard Kerr, CEO of MarketScout said in a statement. “The absence of rate movement could be yet another signal that insurers simply are not going to participate in a price-slashing war as was done in previous market cycles. Low interest rates and better underwriting tools are making insurers cautious.”

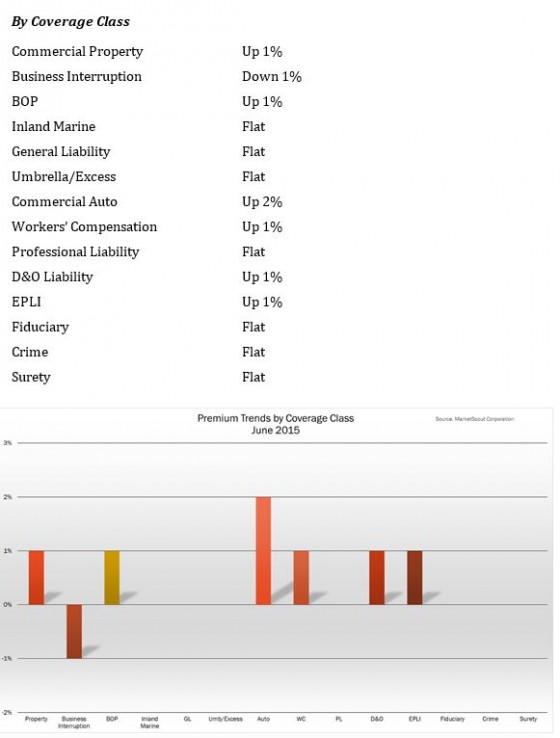
By coverage classification, only one line—business interruption—was down from last month at minus 1% versus flat, or zero increase. Workers compensation, directors and officers and EPLI were up from flat to plus 1%, according to the report.

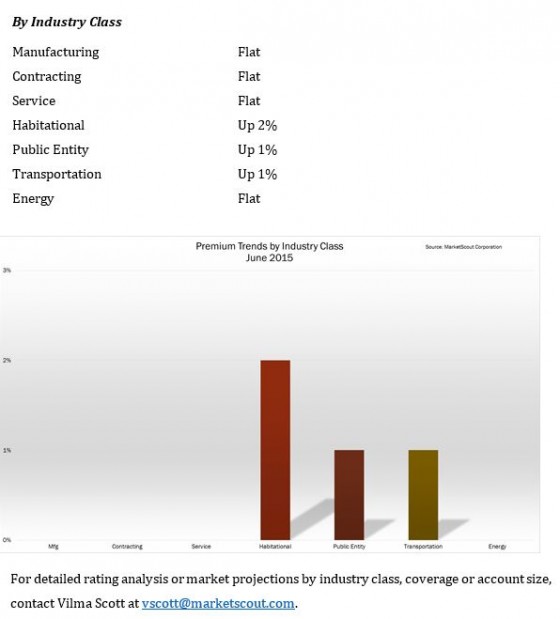
Industry classes balanced out rate movement with contracting adjusting from plus 1% to flat, habitational from plus 1% to plus 2%, and public entity up from flat to plus 1%.

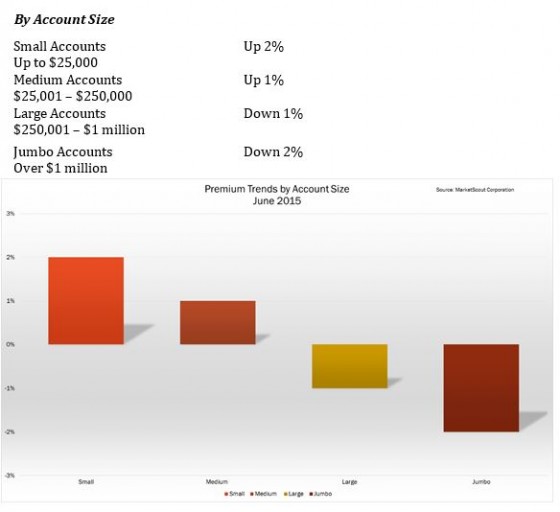
Measured by account size, small accounts (up to $25,000 premium) were up from plus 1% to plus 2%. Large accounts were down from flat to minus 1%. Rates for all other account sizes remained unchanged.

The National Alliance for Insurance Education and Research conducted pricing surveys used in MarketScout’s analysis of market conditions.

Following is a summary of June 2015 rates by coverage, account size  and industry class:


Mitigating Risk with Predictive Modeling

One of most effective risk management philosophies is to work smarter, not harder, implementing holistic tools, such as predictive analytics to ensure it is minimized. More often than not, companies implement blanketed management programs, applying the same strategies to all employees regardless of performance. With this approach, employers waste time and effort focusing on employees who are not at risk, leaving room for at-risk employees to go unnoticed. On an opposing front, many companies use the “squeaky wheel” approach, diverting all of their attention to employees that actively demonstrate troublesome behaviors. While this approach targets a greater amount of at-risk employees, it still leaves room for some to go undetected.

buy rybelsus online haveagreatsmile.com/wp-content/uploads/2023/10/jpg/rybelsus.html no prescription pharmacy

Alternatively, a strategic employee-specific management program allows employers to identify at-risk employees regardless of how “squeaky” they are. The theory behind an employee-specific management program is simple – monitor your employees for changes that indicative risky behavior.

More often than not, these changes are subtle and undetectable to employers. Even with a team of risk management professionals, the necessary attention to detail is near impossible for companies with thousands of employees. So, how can we efficiently monitor for and detect these subtle changes?

Enter predictive modeling

Predictive modeling is an effective tool that addresses the needs of many industries – turning hundreds of thousands of data points into tangible data that can predict anything from consumer demands to credit scoring and anything in between. Challenging traditional personnel management practices, predictive modeling shines a light on the psychology behind today’s work force.

Predictive modeling has become an essential tool for companies across the globe, playing a role in nearly every industry, from marketing to finance, trucking, and the risk management sector. It provides employers with a unique look into the subtle, yet profound, fluctuations in employees’ behaviors that often go undetected. Examining thousands of data points and trends from past events, predictive modeling possesses the power to identify changes in behavioral patterns and predict the outcomes of future events, arming managers with the knowledge needed to proactively intervene with the right employee, on the right subject, at the right time to avoid events such as workers’ compensation claims and voluntary employee turnover.

With this information on hand, employers are able to replace their blanketed risk management program with a streamlined, employee-specific program, saving time and money—and most importantly, lowering risk. To understand the value offered through predictive modeling, one must understand that most employees would not be classified as “at-risk” at the time of employment. It’s the events that occur after the onboarding that mold the employee’s work behavior and create liabilities.

Notably, it is not just work-related problems that can put employees in the “at-risk” category. Often, medical or personal issues can cause changes in an employee’s work habits and behaviors. Tapping into historical data, predictive modeling is able to detect subtle changes and bring at-risk employees forward for remediation. With this information on-hand, managers can proactively connect with their employees to address an issue before it snowballs into a costly incident.

As one of the most risk-prone industries, the transportation space leverages predictive modeling to monitor employees for unsafe driving behaviors which can result in hefty violation fines and accidents. For example, if a driver is dealing with an ill grandmother, he or she may be paying less attention to the road and spending more time on the phone scheduling doctor appointments and responding to calls. Based on past performance, his or her manager will be alerted that the employee is hard-braking more than usual and spending more time in idle. By opening the channels of communication between the driver and manager, they can work together to identify a solution, whether it be an adjusted work schedule or a reduced workload.

Additionally, predictive modeling can help managers focus on causation rather than correlation. When an incident occurs, many managers tend to put emphasis on what happened, not why it happened. As a result, they often work to fix the correlating issue rather than addressing the root cause.

buy valtrex online haveagreatsmile.com/wp-content/uploads/2023/10/jpg/valtrex.html no prescription pharmacy

By analyzing the data gathered through predictive modeling, managers can reflect on the changes in employee behaviors, corporate management or workload leading up to the incident. Recognizing the fluctuation leading up to the accident, managers can proactively monitor for similar incidents and intervene.

An example of this is a risk all managers dread – workers compensation claims. Many companies have accepted workers comp claims as a cost of doing business, failing to understand the factors leading up to the claim. Prior to filing a claim, an employee may be feeling under-motivated and overworked, often putting in the bare minimum and cutting corners with little attention to detail. The reduced attention span lands him or her in trouble when there is a resulting injury on the job and puts the company at risk for a costly claim. With predictive modeling, the manager is able to identify the changes in the employee’s work performance and identify the root cause. Further down the line, the manager can also monitor for similar situations and proactively work with the employee to make his or her work experience more positive.

As managers continue to look beyond traditional methods to better manage their employees and overall company operations, they will be able to capitalize on innovative technologies, such as predictive analytics, to help retain top talent, reduce risk, and build better, longer-lasting relationships with their employees. With growing adoption of proactive risk management solutions, today’s workplace will continue to become a safer, stress-free environment for all.
Quest Data Shows Rise in Positive Test Rates for Workplace Illicit Drugs

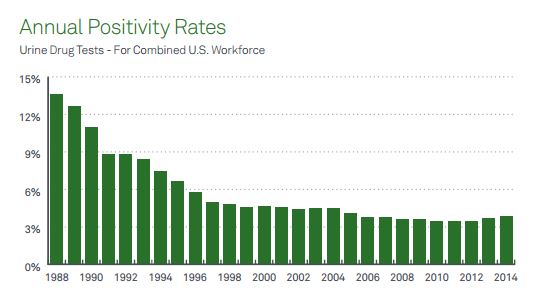
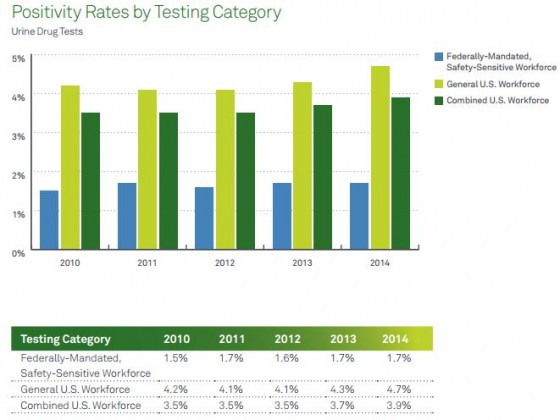
Organizations in the United States that tested employees for drugs saw a 9.3% jump in the number of positive drug tests for illicit drugs in the general workforce, to 4.7% in 2014 from 4.3% in 2013, according to data from Quest Diagnostics. These results may mark a rising trend, as 2013 was the first year since 2003 in which the overall positivity rate for about 1.1 million tests increased in the general U.S. workforce. The analysis shows a potential reversal of a decades-long decline in the abuse of illicit drugs in the U.S. workforce, Quest said.

“American workers are increasingly testing positive for workforce drug use across almost all workforce categories and drug test specimen types. In the past, we have noted increases in prescription drug positivity rates, but now it seems illicit drug use may be on the rise, according to our data,” Dr. Barry Sample, director of science and technology at Quest Diagnostics Employer Solutions, said in a statement.

buy seroquel online azimsolutions.com/wp-content/uploads/2023/10/jpg/seroquel.html no prescription pharmacy

“These findings are especially concerning because they suggest that the recent focus on illicit marijuana use may be too narrow, and that other dangerous drugs are potentially making a comeback.”

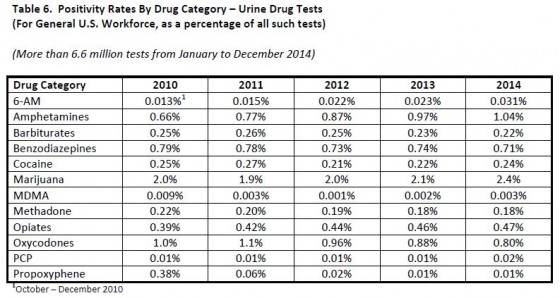
While marijuana continues to be the most commonly detected illicit drug, others include cocaine, methamphetamine and heroin, Quest reported, noting that across all specimen types, the positivity rate for amphetamines is now at the highest levels on record and the positivity rate for methamphetamine is at its highest level since 2007. Amphetamines make up the category that includes both prescription amphetamine drugs like Adderall as well as methamphetamine. The positivity rate for 6-acetylmorphine, or 6-AM, a specific marker for heroin, doubled in the general U.S. workforce between 2011 and 2014, According to Quest.

In urine drug test data from two states with recreational marijuana-use laws, Colorado and Washington, the marijuana positivity rate increased 14% and 16%, respectively, in the general U.S. workforce between 2013 and 2014. This roughly paralleled the national average of 14.

buy vibramycin online azimsolutions.com/wp-content/uploads/2023/10/jpg/vibramycin.html no prescription pharmacy

3%. By comparison, between 2012 and 2013, the marijuana positivity rate increased 20% and 23% in Colorado and Washington, respectively, compared to the national average of 5%, Quest said.

“We were surprised that marijuana positivity increased at about the same rate in Colorado and Washington as the rest of the United States in 2014, particularly given the sharp increases in the marijuana positivity rate in both of these states in the prior year,” Dr. Sample said. “It’s unclear if this data suggest a leveling off in marijuana use in these particular states or if some other factor is at work. We also find it notable that the national marijuana positivity rate increased as much as it did in 2014, and question if this means that people are more accepting and therefore more likely to use marijuana recreationally or for therapeutic purposes than in the past even in states where marijuana’s use is not clearly sanctioned by state laws. This will be an important area of continued analysis given the national debate about the legality and health impacts of recreational and medicinal marijuana use.”

Workers Comp Lessons from Major League Baseball

NEW ORLEANS—Bringing workers compensation under central control and greater oversight has drastically changed the cost and efficacy of one of Major League Baseball’s biggest expenditures. Here at the final day of the RIMS conference, Anthony Avitabile, vice president of industry risk management for Major League Baseball, shared some of his insight on implementing a unified workers comp program to reduce expenses while offering better services.

Although not every business has the high-profile brand or famous talent of a professional sports team, MLB’s example offers some valuable lessons for how large companies with different facilities or franchises can reduce workers comp spend and enhance treatment for employees.

Before 2003, clubs operated individually, placing workers comp insurance independently.

buy lariam online achievephysiorehab.ca/wp-content/uploads/2023/10/jpg/lariam.html no prescription pharmacy

To do so, they called upon varying philosophies related to program structure, medical provider relationships, and off-season indemnity for minor league players who were out of work during a key earnings period outside of the game. Every franchise was fending for themselves when it came to procuring coverage and securing treatment for players. Since 2003, the league has required compliance with a group policy, featuring group insurance purchasing, unified philosophies, and greater information sharing about injuries, expenses and treatment standards. In the year before Avitabile’s program was put into place, total costs incurred peaked in 2002 at about .

buy isofair online achievephysiorehab.ca/wp-content/uploads/2023/10/jpg/isofair.html no prescription pharmacy

3 million, while costs in 2013 were down to .

buy naprosyn online achievephysiorehab.ca/wp-content/uploads/2023/10/jpg/naprosyn.html no prescription pharmacy

8 million.

Critical components of the new program include a drastic effort to understand and review losses across all franchises, what he called a “relentless” effort to manage the process in every club, incentivizing good behavior and results, and instituting universal standards in the approach to coverage. The league made a unilateral decision to dedicate the greatest spend to best-in-class service providers, for example, concluding that return to maximum medical improvement offered the biggest long-term savings. Seizing on the competitive nature shared throughout the league, Avitabile also issues one-page annual scorecards for the CFO and other executives in the individual clubs and review at an organizational level. These show performance relative to other clubs, highlighting top cost drivers and key ways to improve. A workers compensation quality council was also formed to focus on provider agreements, review complex questions regarding released players, and evaluate and implement in-house physical therapy and rehab operations.

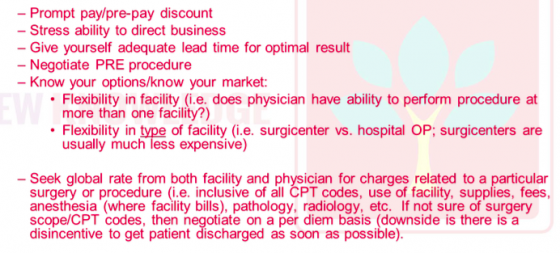
Leveraging the full size and reputation of the league also offered substantial savings in negotiating with providers, which Avitabile cited as one of the biggest areas of savings when managed in advance of any injuries. Partially thanks to volume and ensured prompt payment backed by the organization, these pre-negotiated rates are typically below workers comp state medical fee schedules. Some of his tips for negotiating these provider agreements include:

provider agreement negotiation

Bringing some services in-house also offered considerable savings while maximizing reliable access to top treatment and consistent protocols. The league-wide move to in-house physical therapy instead of third-party treatment, for example, brought total incurred PT and rehab costs down from about $1.6 million in 2002 to approximately $340,000 in 2012.