Для тех, кто интересуется безопасным доступом к онлайн-играм, наш партнер предлагает зеркало Вавады, которое позволяет обходить любые блокировки и сохранять доступ ко всем функциям казино.

How to Use ODG Data to Improve Workers Comp Case Management

Regardless of whether or not their organizations operate in states where the use of Official Disability Guidelines (ODG) has been adopted/mandated, risk managers can often leverage ODG data and the claim data from their risk management information systems (RMIS) to benchmark the medical and lost-time components of their workers compensation costs against national averages.

With its origins dating to 1995, ODG (www.mcg.com/odg) provides “unbiased, evidence-based guidelines” and analytical tools designed to “improve and benchmark return-to-work performance, facilitate quality care while limiting inappropriate utilization, assess claim risk for interventional triage, and set reserves based on industry data.”

The following are some ways risk managers can use ODG data in conjunction with their existing risk information tools to drive improvements in their workers compensation case management and achieve greater precision in loss reserve practices.

  1. Examine the data. ODG has a wealth of data that can be used to benchmark estimated incurred financials and return to work (RTW) best practices by job class, state, injury diagnoses, and numerous other confounding factors (e.g., obesity, diabetes, etc.). You can benchmark guidelines against both current and historical workers compensation claims to identify potential issues and opportunities for individual case management or program improvement. To evaluate trends, you need to capture and analyze detailed data on historical losses (a core capability of RMIS technology). Meanwhile, improving decision-making on open cases calls for the ability to track individual financial and treatment developments on a real-time basis. That is where your RMIS or claims administration platform combined with data streaming from your TPA or carrier can be keys to success.
    buy xenical online www.cappskids.org/wp-content/uploads/2023/10/jpg/xenical.html no prescription pharmacy

  2. Be specific. When looking at historical loss trends and comparing them broadly to ODG loss and recovery data, the sharper your focus, the faster you will be able uncover issues and make needed adjustments to improve individual outcomes or overall practices. Scrutinize data by individual location, job function, injury and even body part involved to get meaningful insights that yield specific action steps and measurable improvements.
    buy nolvadex online www.cappskids.org/wp-content/uploads/2023/10/jpg/nolvadex.html no prescription pharmacy

  3. Track open claims. Leverage the analytics from ODG to compare progress of specific cases against the statistical ODG guidelines. This will enable you to spot variances in recovery timelines and make reasonable adjustments to individual return-to-work plans.
  4. Set goals. You may want to start the benchmarking process with job functions or locations that have historically been the biggest drivers on total cost of risk. Conduct an analysis of historical claims against aggregated ODG data, identify significant variances in your practices versus ODG results, and target specific improvements in open cases. Monitor overall results on a quarterly basis to assess your progress and make any midstream adjustments to align your practices more closely to the ODG findings.
  5. Get help. ODG offers participants training through frequent webinars and other educational events. At the same time, RMIS providers can offer prescriptive guidance in automation that help clients optimize their workers compensation claims operations and return-to-work programs, including the adoption of the analytics available from ODG.

While there are many options available for employers to use predictive analytic benchmarks with workers compensation claims to drive improvements, ODG provides one of the most widely adopted measurements for tracking actual costs of injured employee cases and the success of return-to-work initiatives. When these resources are used in conjunction with a contemporary RMIS, risk managers can gain visibility into claims management issues, focus on improvements that accelerate recovery of injured employees, and start lowering the total cost of workers compensation risk.

buy spiriva inhaler online www.cappskids.org/wp-content/uploads/2023/10/jpg/spiriva-inhaler.html no prescription pharmacy

Follow-Through Needed for Effective Safety Culture

The concept of a culture of safety can be stalled by employers that say they want to be safer, but do little to implement real change.
buy zetia online iddocs.net/images/photoalbum/gif/zetia.html no prescription pharmacy

For example, a company hoping to understand the causes of fatigue, but won’t adjust its schedules, can set itself up for injuries and hazards.

A new report, Making a Safety Culture Truly Cultural, published by KPA, a risk management consultancy found that:

  • 90% of employers want to understand root causes of employees’ fatigue,
    but only 55% say they will adjust schedules or tasks.
  • 51% assign a night shift to an employee immediately before or after a day shift.
  • 60% that know rest is important lack a designated area for employees to do so.

“You may think a workplace fatality is unlikely, but put it into perspective,” the report says. “The Centers for Disease Control and Prevention estimate that a fatal injury could cost nearly $1 million. And the National Safety Council estimates the cost at $1.4 million. Also, factor-in the indirect costs of lost productivity, employee replacement, insurance and attorneys, and the cost jumps to $3 million on average.”

The study offers tips for employers trying to embed safety into their organizational DNA. It also explores how employers who invest time, funds and effort into reshaping their culture can save millions in structural and legal damages.

buy suhagra online iddocs.net/images/photoalbum/gif/suhagra.html no prescription pharmacy

The report puts safety under a microscope to discuss:

  • Its current state in U.S. workplace
  • Where it needs to change
  • How to create a new culture
  • Return on investment
  • How behavioral changes can be key to preventing injuries

The report features case reviews where employers were both proactive and reactive in their efforts to make their workplaces safer. Some were in conjunction with a 2015 OSHA initiative and included adding hands-free tools, re-engineering control systems and installing metal guards to prevent contact with moving machinery.

These actions caused small habit changes that contributed to the larger goal of creating a culture of safety, the report says. Even changing a bad habit such as slow reporting into prompt reporting has proven to reduce future injuries. Addressing one safety issue at a time rather than several concurrently, KPA contends, is the most effective sequence for reshaping a culture.

Habit loops and how cues within those loops translate into the workplace were also explored.

buy bimatoprost online iddocs.net/images/photoalbum/gif/bimatoprost.html no prescription pharmacy

“It’s hard to change habits, but we can fiddle around with the components of the habit loop,” KPA says. “When behaviors become good habits—part of our routine and organizational DNA—that is a clear sign of developing a true safety culture.”

The report is currently available to RIMS members. To download the report, visit the RIMS Risk Knowledge library at www.RIMS.org/RiskKnowledge. All downloads of this publication will be shared with the sponsor, KPA.

To learn about other RIMS publications, educational opportunities, conferences and resources, visit www.RIMS.org.

Workforce Drug Positivity Rate Still Peaking

Workforce use of illicit drugs across the board—including cocaine, marijuana and methamphetamine—remains at its highest rate in a decade, a new study by Quest Diagnostics found.

Overall positivity in urine drug testing among the combined U.S. workforce in 2017 continued to hold at 4.2%, which is still 0.7% higher than the positivity rate from 2012, which represented a 30-year low. The findings were made from analysis of more than 10 million workforce drug test results.

“It’s unfortunate that we mark 30 years of the Drug-Free Workplace Act with clear evidence that drugs continue to invade the country’s workplaces. Not only have declines appeared to have bottomed out, but also in some drug classes and areas of the country drug positivity rates are increasing,” Barry Sample, senior director of science and technology at Quest Diagnostics, said in a statement.

buy chloroquine online orthosummit.com/wp-content/uploads/2023/10/jpg/chloroquine.html no prescription pharmacy

“These changing patterns and geographical variations may challenge the ability of employers to anticipate the ‘drug of choice’ for their workforce or where to best focus their drug prevention efforts to ensure a safe and healthy work environment.”

The new data indicates shifting patterns of drug use, with cocaine and amphetamines positivity surging in some areas of the country and marijuana positivity rising sharply in states with newer recreational use statutes.

Opioids
The one bit of good news is that prescription opiate positivity rates declined dramatically on a national basis. Quest reported that the positivity rate for opiates in the general U.S. workforce in urine drug testing declined 17% between 2016 and 2017 (0.47% versus 0.39%). More notably, oxycodones (oxycodone and/or oxymorphone) positivity declined 12% between 2016 and 2017 (0.69% vs. 0.61%), hydrocodone positivity declined 17% (0.81% vs. 0.67%); and hydromorphone positivity declined 22% (0.59% vs. 0.46%). Opiates other than codeine were at their lowest positivity rate in more than a decade.

This data is supported by the Centers for Disease Control and Prevention (CDC), which shows that the overall national opioid prescribing rate in 2017 fell to the lowest it had been in more than 10 years, although rates vary by state and are high in some areas of the country.

The topic was explored during an educational session at RIMS 2018, where it was noted that the decrease in opioid use may be attributed to corporate initiatives like prescription drug monitoring policies (PDMP), which can limit employees’ ability to refill scripts, in addition to states that had comprehensive reforms.

“This shows that the more queries there are, the bigger the drop in opioid prescribing,” said John Ruser, president and CEO of the Workers Compensation Research Institute (WCRI), last month in San Antonio. He said WCRI used Kentucky as an example of a successful PDMP. Kentucky’s HB1 law mandated the use of the PDMP and between 2011 and 2013, WCRI information indicated a 10% decline in prescriptions in the state, whereas prescription levels were flat in others that did not have similar reforms.

Methamphetamine
Methamphetamine positivity, however, is increasing. An analysis of trends in the general U.S. workforce based on the four U.S. Census regions identified large increases of methamphetamine positivity rates. Between 2013 and 2017, methamphetamine positivity increased: 167% in the East North Central division of the Midwest (Illinois, Indiana, Michigan, Ohio, Wisconsin); 160% in the East South Central division of the South (Alabama, Kentucky, Mississippi, Tennessee); 150% in the Middle Atlantic division of the Northeast (New Jersey, New York, Pennsylvania); and 140% in the South Atlantic division of the South (Delaware, District of Columbia, Florida, Georgia, Maryland, North Carolina, South Carolina, Virginia, West Virginia). The percentage increase in these four divisions ranged between 9% and 25% between 2016 and 2017.

Marijuana
Overall, marijuana positivity continued its five-year upward climb for both the general U.S. workforce and the federally-mandated, safety-sensitive workforce. Marijuana positivity increased 4% in the general U.S. workforce (2.5% in 2016 versus 2.6% in 2017) and nearly 8% in the safety-sensitive workforce (0.78% versus 0.84%).

Increases in positivity rates for marijuana were most striking in states that have enacted recreational use statues since 2016. Those states include: Nevada (43%), Massachusetts (14%) and California (11%). These three states also saw significant increases in marijuana positivity in federally-mandated, safety-sensitive workers: Nevada (39%), California (20%), and Massachusetts (11%). Federally-mandated, safety-sensitive workers include pilots, rail, bus and truck drivers, and workers in nuclear power plants, for whom routine drug testing is required by the Department of Transportation.

buy augmentin online orthosummit.com/wp-content/uploads/2023/10/jpg/augmentin.html no prescription pharmacy

“These increases are similar to the increases we observed after recreational marijuana use statues were passed in Washington and Colorado,” Sample said. “While it is too early to tell if this is a trend, our data suggest that the recreational use of marijuana is spilling into the workforce, including among individuals most responsible for keeping our communities safe.”

Prescription Opioid Risks to the Workplace Explored at RIMS 2018

SAN ANTONIO – When the White House declared opioid use a national Public Health Emergency under federal law in 2017, businesses began reviewing their policies and making efforts to curb their employees’ abuse of the drug in its prescribed form. This escalating risk to organizations is why the business impact of prescription opioid use was such a hot topic at RIMS 2018, where a session on April 17 focused on the practical and bottom-line costs of workforce use of prescription opioids. In a session the next day, attendees learned how liability policies are responding to government-led lawsuits against opioid manufacturers, and how to prepare for similar suits brought against other industries.

New Insights into the Impact of Opioid Prescribing to Injured Workers
Data displayed on Tuesday explored opioid-related correlations between worker, industry and employer. Presenters John Ruser, president and CEO of the Workers Compensation Research Institute (WCRI) and Michael Fenlon, senior director of corporate risk management for United Parcel Service (UPS) discussed opioid-related claims and suggested evidence-based information that can encourage a return to work without the prescriptions.

The effectiveness of prescription drug monitoring policies (PDMP) was explored, and Ruser explained that a reactive shift among prescribers has meant that states obligated to adhere to these policies have fewer prescriptions written.

“This shows that the more queries there are, the bigger the drop in opioid prescribing,” he said, using Kentucky as an example of a successful PDMP. He added that Kentucky’s HB1 law mandated the use of the PDMP and has set a standard among states since it was enacted in July 2012. Between 2011 and 2013, WCRI information indicated a 10% decline in prescriptions in the state, whereas prescription levels were flat in others that did not have comprehensive opioid reforms.

Fenlon said that when he learned in recent years that opioid overdoses—almost half of which arise from prescriptions—surpassed car accidents as the number one cause of accidental death, he realized the severity of the issue and its impact on the UPS workforce.

“Once someone gets to that third or fourth script, you can see how it leads to a vicious cycle,” he said. “We need to take ownership of this—in the workers comp space as well as the healthcare side.”

He noted that UPS’ overall pharmacy spend is about 7% of its total medical costs per year for lost-time (LT) patients, with opioids comprising about 22% of that amount. UPS employs more than 454,000 workers, and Fenlon said the company continually pays close attention to the LT patients who are the higher-risk group, with three or more scripts. He added that the collaboration of drug formularies, third-party administrators and UPS case supervisors has contributed to the 44% decrease of the higher-risk group between 2013 and 2017.

Both presenters conceded, however, that injured workers will likely get the medication they need, even if it is not in the form of opioids. “Those who are worried about pain management are noticing the trend in the decline of opioid prescriptions in some areas and ask: ‘What’s the alternative?’” Ruser said. “While there was a drop in that drug, there was an increase in the amount of NSAIDs [nonsteroidal anti-inflammatory drugs]. Clearly, that’s what these prescribers are shifting to, so it’s not that these injured workers are not receiving pain meds.”

Members may access this PowerPoint presentation by logging in at the RIMS 2018 session handout page.

Opioid Lawsuits: A Tsunami of Litigation and Associated Coverage Issues
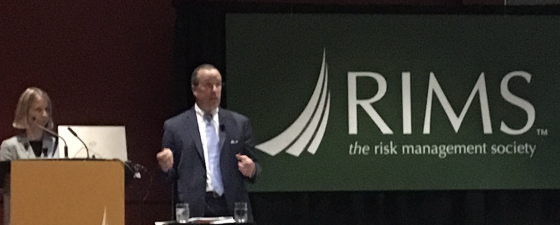
The topic shifted from boardrooms to courtrooms the next day, as current and pending multidistrict litigations filed by various governments (local, city and state) were examined. Covington & Burling LLP Partner Anna Engh and Marsh Managing Director John Denton (pictured below) discussed insurance policies’ responses to lawsuits and provided insight as to how to prepare should similar suits be brought against other industries.
Manufacturers, distributors, retailers, prescription benefit managers, doctors and clinics are all seemingly in the crosshairs of local municipalities and governmental entities, Engh noted.

“The main focus against the manufacturers is of alleged misrepresentation of the addictive nature of opioids. With respect to the distributors, it is the failure to report and detect suspicious orders, or failing to have controls in place for their diversions,” Engh said. “You’ll see negligence pled in different ways, like common-law negligence, and also pled as violations of states’ controlled substance acts.” She added that public nuisance and RICO claims (Racketeer Influenced and Corrupt Organizations Act) also appear on the dockets.

With nearly 500 claims against pharmaceutical companies, distributors and pharmacies consolidated in Ohio alone, Denton said that the volume of work involved is daunting for insurance, risk and legal professionals.

“That’s thousands of pages of pleadings coming in every month. It’s a very difficult burden,” he said. “I think a lot of companies are tendering them to as many policies as possible. Hopefully, a lot of insurance carriers will be understanding of this. And a lot of this will be sorted out later, either through discussions with the carriers or litigation.”

Denton added that because there is no federal judicial precedent on insurance suits, the progress on such matters will continue to be slow.

“Insurance coverage issues are typically an issue of state law. And with lawsuits in nearly every state, it would be nice to have a [United States] Supreme Court decision on some of these coverage issues, and that would bind everybody,” he said. “But the reality is that’s not going to happen. There will be decisions in multiple states so it may take some time before these issues get sorted out.”