LeapWallet is a secure digital wallet that enables easy management of cryptocurrencies. With features like fast transactions and user-friendly interface, it's perfect for both beginners and experts. Check it out at leapwallet.lu.

Inadequate Emergency System Contributes to Indonesia’s Rising Death Toll Following Earthquake and Tsunami

The death toll on Indonesia’s island of Sulawesi has risen to 1,200 as of this morning, in the aftermath of a 7.5 magnitude earthquake on Friday and the tsunami that followed. As emergency crews still lead efforts to locate and save victims and clear debris, officials warn that the number of casualties could rise further.

The current warning system is comprised of tidal gauge stations augmented by land-based seismographs, sirens in about 55 locations and a system to disseminate warnings by text message. Time reported that the country had not updated its emergency notification systems (ENS) following the 2004 tsunami that devastated the region, due in part to lack of funding. According to Time:

The high-tech system of seafloor sensors, data-laden sound waves and fiber-optic cable was meant to replace a system set up after an earthquake and tsunami killed nearly 250,000 people in the region in 2004. But inter-agency wrangling and delays in getting just 1 billion rupiah ($69,000) to complete the project mean the system hasn’t moved beyond a prototype developed with $3 million from the U.S. National Science Foundation.

Analysts say that a proper ENS would have provided earlier warnings of the disasters and may have prevented some of the casualties.

buy xifaxan online physiciansalliance.com/wp-content/uploads/2022/08/pdf/xifaxan.html no prescription pharmacy


At the time of impact, the country was already dealing with the fallout of major seismic activity in the region. Within the span of about a week in late July and early August, the Indonesian resort island of Lombok was the site of intense earthquakes that killed hundreds, displaced hundreds of thousands and destroyed more than 13,000 houses.

Indonesia is prone to earthquakes because of the country’s location in the “Ring of Fire,” the arc of volcanoes and active fault lines in the Pacific Basin.

buy neurontin online physiciansalliance.com/wp-content/uploads/2022/08/pdf/neurontin.html no prescription pharmacy

Sutopo Purow Nugroho, a National Disaster Mitigation Agency spokesman, said communications with the earthquake-stricken region were disrupted.

buy sinequan online physiciansalliance.com/wp-content/uploads/2022/08/pdf/sinequan.html no prescription pharmacy

“Our early estimation, based on experience, is that it caused widespread damage, beginning from Palu northward to Donggala,” he told MetroTV.

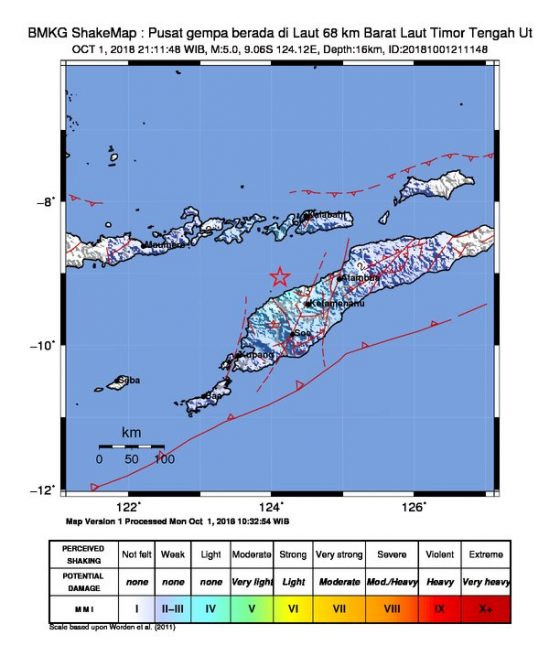
It seems as though social media will have to play a more central role in alerting the public of new disasters. This morning, Indonesia’s Meteorological, Climatological and Geophysical Agency (BMKG) tweeted a new alert of a 5.0 magnitude quake near the North Central Timor Regency in East Nusa Tengarra – an Indonesian province – that could potentially lead to a tsunami.

Resiliency in 2018: Q&A With BCI’s David Thorp

Organizational resiliency is a focus of the Business Continuity Institute (BCI) and executive director David Thorp. It was the theme of this year’s annual Business Continuity Awareness Week, which Risk Management Monitor covered in May, and was the focus of BCI’s updated manifesto.

We reached out to Thorp to get his insight on organizational resiliency, how businesses can improve their continuity plans and for ways to better incorporate them into their culture.

Risk Management Monitor: What companies have best demonstrated resilience?

David Thorp: A few examples of organizations that have displayed a high level of resilience are Apple, TomTom, and PostNL.

Apple displayed resilience when they reemployed Steve Jobs to reshape the company.

TomTom started by making software for Palm computers. It has dealt with a rapidly changing marketplace and over the years it has:

  • produced navigation software for PDAs (personal digital assistant)
  • produced its own navigation devices
  • developed live traffic information
  • acquired a digital mapping company
  • developed navigation software for smartphones
  • struck up deals with car manufacturers

PostNL (formerly TNT) has had to adapt to the decline in regular mail as well as tapping into the requirement to deliver more packages (outside working hours) as a result of an increase of web shops.

RMM:  What do organizations most commonly overlook in their continuity planning?

DT: Two most commonly overlooked aspects are keeping plans up to date and exercising/testing.

Business continuity management is often initiated as a project, usually assisted with external expertise. Internal personnel frequently have this role in addition to their “normal” functions. As the organization changes, these plans often get overlooked. After one or two exercises have been carried out, the focus on exercising quickly diminishes.

Unfortunately, these two aspects have a large impact on the ability to recover as planned. It could be argued that this is an indication of a lack of management commitment.

RMM: Why do so many companies overlook their continuity planning and emergency preparedness?

DT: The biggest reason is that it is not a requirement for many organizations. When not required by a regulator or a customer, the organization must:

  1. know about continuity planning and emergency preparedness
  2. understand their risk
  3. understand its value before there is a possibility of it being implemented

By not having done a risk or impact analysis, it is also easy for organizations to think that a disruptive event will not happen to them and therefore not worth the hassle and investment.

RMM: How much time and effort does creating and initiating a business continuity plan take?

DT: This depends on the size and complexity of the organization, the ambition level and the resources available. For small organizations, it is possible to create and exercise plans within a month—but this would typically take a little longer as the required people will also have other tasks. For a large and more complex organization, it may take two-to-three years to reach the desired maturity level.

RMM: What advances would you like to see the global risk management community achieve with regard to planning and preparedness?

DT: I would like to see a better understanding of each other’s disciplines and a better collaboration between them. There is much overlap between the two disciplines and with better collaboration, we can more efficiently and effectively minimize risks and improve the continuity. We are currently working on better understanding how we achieve synergy between business continuity and risk management. We see this as being a prerequisite for achieving organizational resilience. Collaboration with other disciplines is also necessary.

RMM: We’ve seen examples of reputation crises that have in some cases forced companies to close. How can organizations avoid these pitfalls?

DT: A major factor in managing the extent of the reputation damage is the quality of the crisis communication. How well and honestly you inform those affected and of course how you deal with social media makes the difference in how you are perceived. The subsequent actions need to be in line with the messages communicated.

RMM: What has changed in the BCI’s Manifesto for Organizational Resilience that risk professionals should know about?

DT: The manifesto is built on the simple premise that resilience is not the responsibility of one part of the organization—it is the responsibility of discipline within an organization working closely together toward a common purpose. Risk Management, emergency planning, disaster recovery, security, facilities management, business continuity management, supply chain management, IT management, HR management…all have an equal role to play in delivering resilience.

The manifesto contains our undertaking to seek out alliances with other professional bodies along the spectrum of what might be termed “resilience disciplines” in order to work collaboratively. This would make organizations more resilient than if we each work within our own silo.

Workforce Drug Positivity Rate Still Peaking

Workforce use of illicit drugs across the board—including cocaine, marijuana and methamphetamine—remains at its highest rate in a decade, a new study by Quest Diagnostics found.

Overall positivity in urine drug testing among the combined U.S. workforce in 2017 continued to hold at 4.2%, which is still 0.7% higher than the positivity rate from 2012, which represented a 30-year low. The findings were made from analysis of more than 10 million workforce drug test results.

“It’s unfortunate that we mark 30 years of the Drug-Free Workplace Act with clear evidence that drugs continue to invade the country’s workplaces. Not only have declines appeared to have bottomed out, but also in some drug classes and areas of the country drug positivity rates are increasing,” Barry Sample, senior director of science and technology at Quest Diagnostics, said in a statement.

buy chloroquine online orthosummit.com/wp-content/uploads/2023/10/jpg/chloroquine.html no prescription pharmacy

“These changing patterns and geographical variations may challenge the ability of employers to anticipate the ‘drug of choice’ for their workforce or where to best focus their drug prevention efforts to ensure a safe and healthy work environment.”

The new data indicates shifting patterns of drug use, with cocaine and amphetamines positivity surging in some areas of the country and marijuana positivity rising sharply in states with newer recreational use statutes.

Opioids
The one bit of good news is that prescription opiate positivity rates declined dramatically on a national basis. Quest reported that the positivity rate for opiates in the general U.S. workforce in urine drug testing declined 17% between 2016 and 2017 (0.47% versus 0.39%). More notably, oxycodones (oxycodone and/or oxymorphone) positivity declined 12% between 2016 and 2017 (0.69% vs. 0.61%), hydrocodone positivity declined 17% (0.81% vs. 0.67%); and hydromorphone positivity declined 22% (0.59% vs. 0.46%). Opiates other than codeine were at their lowest positivity rate in more than a decade.

This data is supported by the Centers for Disease Control and Prevention (CDC), which shows that the overall national opioid prescribing rate in 2017 fell to the lowest it had been in more than 10 years, although rates vary by state and are high in some areas of the country.

The topic was explored during an educational session at RIMS 2018, where it was noted that the decrease in opioid use may be attributed to corporate initiatives like prescription drug monitoring policies (PDMP), which can limit employees’ ability to refill scripts, in addition to states that had comprehensive reforms.

“This shows that the more queries there are, the bigger the drop in opioid prescribing,” said John Ruser, president and CEO of the Workers Compensation Research Institute (WCRI), last month in San Antonio. He said WCRI used Kentucky as an example of a successful PDMP. Kentucky’s HB1 law mandated the use of the PDMP and between 2011 and 2013, WCRI information indicated a 10% decline in prescriptions in the state, whereas prescription levels were flat in others that did not have similar reforms.

Methamphetamine
Methamphetamine positivity, however, is increasing. An analysis of trends in the general U.S. workforce based on the four U.S. Census regions identified large increases of methamphetamine positivity rates. Between 2013 and 2017, methamphetamine positivity increased: 167% in the East North Central division of the Midwest (Illinois, Indiana, Michigan, Ohio, Wisconsin); 160% in the East South Central division of the South (Alabama, Kentucky, Mississippi, Tennessee); 150% in the Middle Atlantic division of the Northeast (New Jersey, New York, Pennsylvania); and 140% in the South Atlantic division of the South (Delaware, District of Columbia, Florida, Georgia, Maryland, North Carolina, South Carolina, Virginia, West Virginia). The percentage increase in these four divisions ranged between 9% and 25% between 2016 and 2017.

Marijuana
Overall, marijuana positivity continued its five-year upward climb for both the general U.S. workforce and the federally-mandated, safety-sensitive workforce. Marijuana positivity increased 4% in the general U.S. workforce (2.5% in 2016 versus 2.6% in 2017) and nearly 8% in the safety-sensitive workforce (0.78% versus 0.84%).

Increases in positivity rates for marijuana were most striking in states that have enacted recreational use statues since 2016. Those states include: Nevada (43%), Massachusetts (14%) and California (11%). These three states also saw significant increases in marijuana positivity in federally-mandated, safety-sensitive workers: Nevada (39%), California (20%), and Massachusetts (11%). Federally-mandated, safety-sensitive workers include pilots, rail, bus and truck drivers, and workers in nuclear power plants, for whom routine drug testing is required by the Department of Transportation.

buy augmentin online orthosummit.com/wp-content/uploads/2023/10/jpg/augmentin.html no prescription pharmacy

“These increases are similar to the increases we observed after recreational marijuana use statues were passed in Washington and Colorado,” Sample said. “While it is too early to tell if this is a trend, our data suggest that the recreational use of marijuana is spilling into the workforce, including among individuals most responsible for keeping our communities safe.”