Проблемы с доступом больше не помеха. Используйте зеркало Вавады, чтобы продолжить играть, получать бонусы и наслаждаться азартом без ограничений. LeapWallet is a secure digital wallet that enables easy management of cryptocurrencies. With features like fast transactions and user-friendly interface, it's perfect for both beginners and experts. Check it out at leapwallet.lu.

After Oklahoma, the Tragedy and Science of Tornadoes

The storm that destroyed large swaths of Oklahoma was unfathomably destructive. It’s vast size was frightening, its energy enormous, its tragedy permanently unforgettable. Even with all the tornadoes to ravage the U.S. landscape in recent years, this one is uniquely disturbing. The images of flattened neighborhoods full of shattered-toothpick homes and mangled cars look make believe.

With at least 24 dead and more than 200 injured, the human toll has been massive.

In this video, Moore, Oklahoma, Mayor Glenn Lewis discusses the devastation.

Though difficult, the future of preparing for tornadoes means looking beyond the immediate recovery and tragedy. It means looking for lessons learned and ways to better understand the threat.

Many media outlets are asking the right questions.

Foreign Policy, for example, asked “Why does the U.S. have so many more tornadoes than other countries?” The short answer: It “stems from a mix of climatological, topographical, and geographic factors.”

Such factors mean that the United States averages more than 1,000 reported tornadoes per year while the next-most-hit nation, Canada, only suffers from around 100 reported tornadoes per year. The Wall Street Journal’s contributing meteorologist, Eric Holthaus, broke down some of the weather-reasons that tornadoes occur.

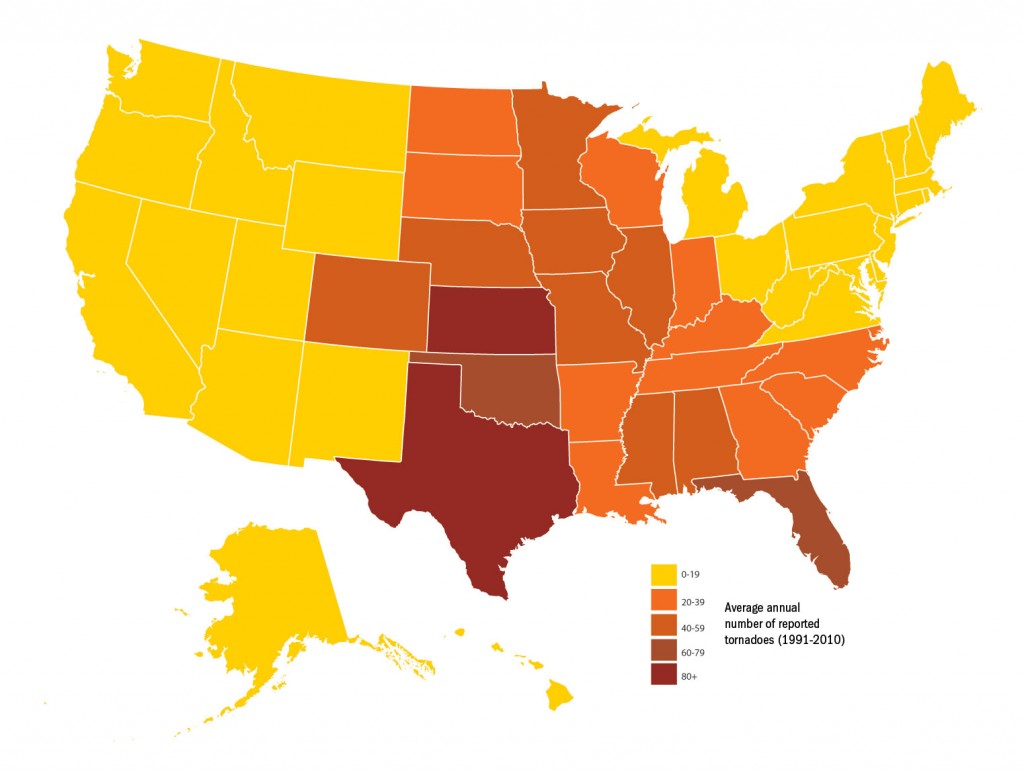
And here is a graphic, from the May issue of Risk Management, that shows where they occur in the United States. The so-called “Tornado Alley.”

(click for larger map)

While the United States’ predisposition to be stuck by tornadoes isn’t questioned by climatologists, a key word is “reported.” In some ways, our ability to understand tornadoes falls behind other natural disasters (namely hurricanes and earthquakes) due to the fact that we still can’t accurately know exactly when or how many tornadoes occur each year. They can be rapidly forming and dissipating funnels of wind, so unless there is someone nearby to witness them or human-made structures to be affected, some go unreported.

Given the progression of development and technology, that is much less so the case in 2013 than it was in 1950. But it is still a factor in our collective ignorance.

For example, the number of reported tornadoes in the United States has risen rapidly over the past 60 years. Some have tried to tie this increase to weather trends or climate change.

But the fact that more are being reported doesn’t necessarily mean more are occurring.

I wrote on the topic for the May issue of Risk Management.

Even in the United States — by far the world’s most frequent victim of twisters — detailed records only go back to 1950. Since then, there has been an average increase of 14 reported tornadoes per year. But any attempt to tie the rise to the weather would be an exercise in analyzing guesswork. Most experts believe this rise is due to advances in science, technology and observational techniques — not to mention the number of homes and businesses that are hit — rather than any objective trend that proves more tornadoes are occurring.

Really, nobody knows — now or then — how many tornadoes occur each year. “Socio-economic factors provide a better explanation for this trend than meteorological ones,” states a report by Lloyd’s of London.

Those who lost loved ones during 2011, a record-setting year for twisters, are unlikely to take solace in this fact. But “despite the anomalous 2011 season,” says the Lloyd’s report, “there is no trend in the number of strong to violent tornadoes between 1950 and 2012.”

In addition to the challenge of knowing how many tornadoes occur, there is the difficulty of predicting when and where they will occur.

The Washington Post‘s Wonkblog, is asking “Why are tornadoes so hard to predict?”

The short answer, from Carbin of the National Weather Service Storm Prediction Center:

“There are so many mild adjustments, slight adjustments that can make a huge difference in whether you end up getting the formation of storms. The sensitivity the atmosphere has to ingredients in the formation of tornados and magnifying that slight change in something we can’t even observe can have a dramatic impact on the forecast.”

Still, despite the limitations, things are improving.

It may not sound like significant progress, but even minutes saves lives.

Just 16 minutes before a gigantic twister first developed near Oklahoma City on Monday, the National Weather Service put out a tornado warning.

The tornado warning issued for the region south of Oklahoma City on Monday, May 20, at 2:46 p.m. (Via Mike Smith)

That doesn’t sound like very much time to get out of the way. For many, it wasn’t: At least 24 people died when the tornado ripped a mile-wide path through the city of Moore, Okla.

But those 16 minutes actually represent an enormous advance for weather science. Back in the 1980s, the average tornado lead time was a scant five minutes. Today, it’s about 13 minutes.

What’s more, meteorologists are now able to issue alerts and storm forecasts even earlier, thanks to powerful computers that allow them to run detailed weather simulations. The Oklahoma City area had been identified as an at-risk area days before the twister actually struck. And the National Weather Service’s Rick Smith issued an eerily prescient forecast at 11:30 a.m. Monday, alerting people to the threat of tornadoes that very afternoon.

Just how much more improvement is possible?

Carbin told the Washington Post that “we might be able to get, say, an hour lead-time on a tornado.”

That time frame, as a goal, sounds depressing. It’s certainly going to make tornadoes forever more difficult to prepare for than, say, hurricanes. But then again, it is a lot better than, say, earthquakes, which generally give zero seconds of notice.

As discussed on Wonk Blog, the world has also gotten better at understanding tornado behavior once a storm forms and is detected. This also adds time for those who might be in a twister’s path in a half an hour as opposed to those who reside near its formation.

A journalist from Arkansas I spoke with yesterday also noted another benefit of being able to better predict where a tornado is headed. Historically, throughout many areas of the South and Midwest, tornado sirens and warnings would be issued for very-large areas. Two whole counties perhaps.

This makes sense. Precaution is obviously the best strategy.

But it also has breed complacency. Some locations face many tornado warnings every year, and if multiple “DEFCON Ones” are declared that never present real threats, people naturally start to take safety for granted. The Boy Who Cried Wolf and all.

With better projections on trajectory and more-precise warning systems, however, sirens only have to be sounded for those who are actually at direct risk of the threat. Those who are likely to remain safe for the next two hours may not have to be told to hunker down in their basements. And in time this should lead to a population who comes to have better respect for the warnings of authorities.

Ultimately, this is all still very difficult science.

The truth is that as tragic as this tornado in Oklahoma has been, there will be more. 2011 was a historic year for twisters and the folks in Joplin, Mississippi, certainly share Moore’s pain. Even past residents of Moore feel the current residents of Moore’s anguish, as another devastating tornado ripped through the same community in 1999.

The hope, however, is that through knowledge, science, preparedness and resiliency, all citizens, municipalities and businesses will be more ready tomorrow than they are today for when the next tornado hits.

Hopefully, the next tragedy can be less tragic.

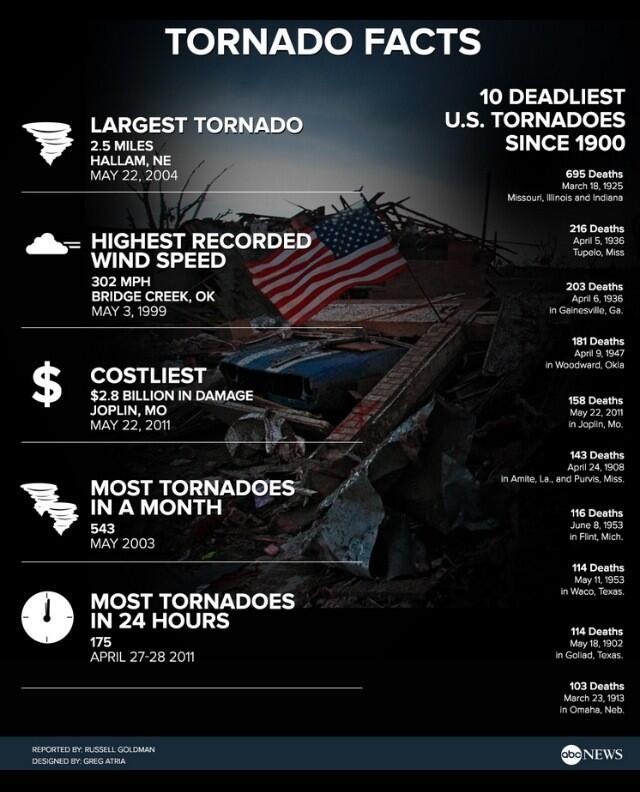
infographic via @Nightline

The Largest Natural Hazard Risks of 2012

2012 was a year of natural catastrophes. From Hurricane Sandy to the record-setting drought to the third most destructive wildfire season on record, the year was fraught with disasters that took a toll not only on communities nationwide, but on some of the world’s largest insurers. Today, CoreLogic issued its annual Natural Hazard Risk Summary, which details the most significant natural disasters that struck the United States in 2012. It notes the following:

Hurricanes

  • The single most destructive natural disaster in 2012 was Hurricane Sandy. In late October, the Category 1 storm generated record levels of storm surge along the northern New Jersey coast and in the New York City area, impacting more than five million residents across the region.
  • The first hurricane to make landfall in the U.
    buy stendra online cosmeticdermcenter.com/wp-content/uploads/2023/10/jpg/stendra.html no prescription pharmacy

    S. in 2012 was Category 1 Hurricane Isaac in late August, which caused an estimated $2 billion in insured losses around the New Orleans metro area.

Floods

  • Flood losses are expected to total approximately $10 billion in 2012, which would result in the third consecutive year of increasing flood damage in the U.S.
  • Earlier in the year, Tropical Storm Debby tracked slowly across the Florida peninsula in June, dropping at least 25 inches of rainfall along its path.
  • After months of sustained, widespread drought, Hurricane Isaac brought heavy rainfall and flooding to Louisiana in late August before continuing northward into the Midwest.
    buy arimidex online cosmeticdermcenter.com/wp-content/uploads/2023/10/jpg/arimidex.html no prescription pharmacy

Wildfires

  • The 2012 wildfire season was the third most destructive on record in the U.S. in terms of total acres burned as of early December.
  • The 15-year trend of fewer, but larger fires continued into 2012 with fewer than 51,000 individual wildfires across the country—the lowest number recorded since 1989.
  • Several of the individual fires that occurred in 2012 set records, including Colorado’s Waldo Canyon Fire, which damaged or destroyed 346 homes, and New Mexico’s Whitewater-Baldy Fire, which burned more than 297,000 acres.
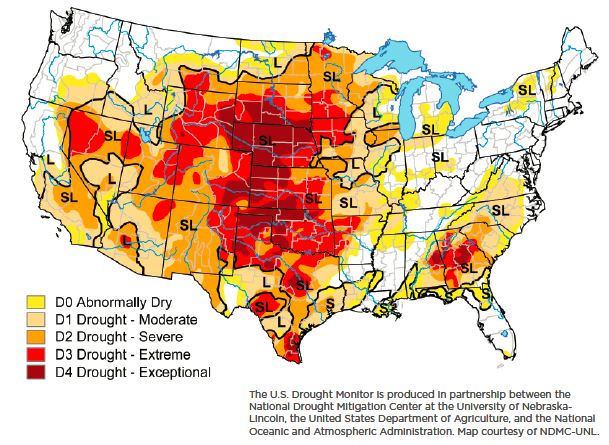
  • NOAA continues to predict a pattern of drought conditions through the start of 2013, suggesting the potential for another increase in wildfire risk across much of the country. In the chart below, “SL” stands for short-term drought (typically less than six months) and “L” stands for long-term drought (typically more than six months).

Tornadoes

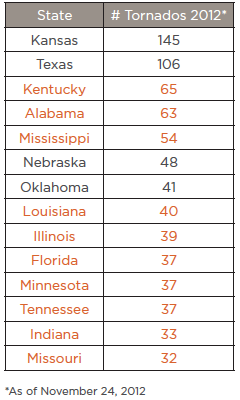
  • Tornado activity in 2012 was not strictly limited to the region commonly referred to as “Tornado Alley.” States located outside the central and southern Great Plains experienced a significant number of tornadoes this year. The chart below, from CoreLogic’s report, represents states with 30 or more tornadoes in 2012. States in orange are not typically considered part of “Tornado Alley.”
  • January 2012 was one of the most active Januaries since recording began in 1950, with a total of 79 tornadoes reported across the country.
  • In late February, tornadoes struck Illinois, Indiana, Kentucky and Ohio. Harrisburg, Ill., experienced the most concentrated destruction, with more than 225 homes and businesses damaged or destroyed and an estimated $475 million in total damage.

“Because the strength, severity and geographic impact of natural disaster events will change from year to year, an understanding of patterns in hazard activity, geographic vulnerabilities and the properties exposed to each different type of disaster is crucial to managing risk,” said Dr. Thomas Jeffery, senior hazard scientist for CoreLogic.

As we’ve seen with the natural catastrophes of 2012, it is important for insurers, homeowners and businesses to develop a more comprehensive evaluation of risk — one that includes typically non-traditional locations.

buy lasix online haveagreatsmile.com/wp-content/uploads/2023/10/jpg/lasix.html no prescription pharmacy

Storm Risk Reaches Well Beyond Tornado Alley

We’ve heard it over and over again: 2011 was the costliest year on record for natural disasters. From triple-digit heat waves and devastating drought to overflowing rivers and deadly tornadoes, the U.S. rang up natural disaster costs in the billions and much time and effort of rebuilding.

But what wasn’t talked about so much was the fact that much of the tornado risk was located outside of the traditionally storm prone tornado alley, according to a new report by CoreLogic. “The apparent increase in the number of incidents and shift in geographic distribution of losses that occurred last year in the U.S. called the long-held notion of risk concentration in Tornado Alley into question, and is leading to changes in risk management policy and procedure,” said Dr. Howard Botts, vice president and director of database development for CoreLogic Spatial Solutions.

CoreLogic’s “Tornado and Hail Risk Beyond Tornado Alley” report analyzes hazard risk at the state-level across the U.S using the company’s wind and hail data layers. Key findings include:

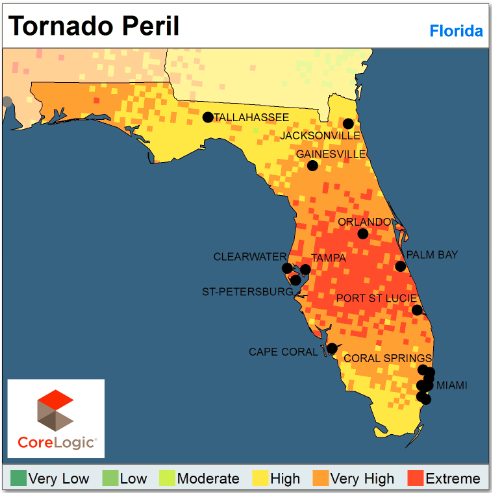
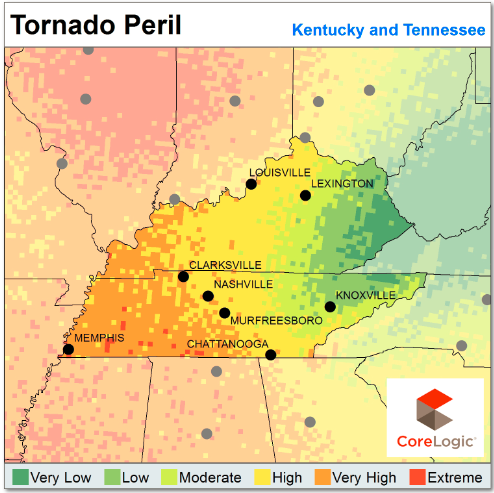
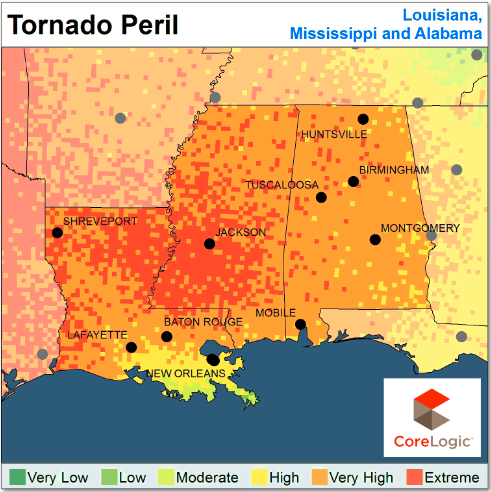
  • Tornado risk actually extends across most of the eastern half of the U.S. rather than being confined to the Midwest
  • According to data from the National Oceanic and Atmospheric Association (NOAA), of the top ten states with the highest number of tornado touchdowns between 1980 and 2009, only three actually fell within Tornado Alley
  •  At least 26 states have some area facing extreme tornado risk
  • At least 11 states have significant areas facing extreme hail risk, and almost every state east of the Rocky Mountains has some area facing a moderate or higher level of hail risk
  • The area of highest hail risk extends outward from the central Great Plains to include states as far east as Georgia and the Carolinas

These findings have obvious insurance implications, but it goes beyond that to disaster preparation and natural catastrophe risk management in areas not historically prone to such events. CoreLogic released the maps below, indicating tornado peril in non-tornado alley states.

Insurers and residents alike should be aware of the high risk of tornadoes, wind and hail in these areas. For the complete report, including and in-depth descprition of how CoreLogic created the above maps, click here.

Slowly But Surely, Joplin Is Recovering

Dictionary.com defines resiliency as “the power or ability to return to the original form … after being bent, compressed, or stretched.” True devastation takes a while to bounce back from. But Joplin is showing us how it is done every day.

Above is a video from CBS, which calls the fact that kids in the ravaged Missouri town “simply having a school to attend this fall is nothing short of remarkable.” According to the report, 10 of the town’s 19 schools were destroyed by the storm that killed 160 people. But by setting up classrooms in warehouses and using other creative methods, officials expect 90% of the students to be back in school.

Joplin East Middle School Principal Bud Sexton is happy about that, noting that “getting students back to school on [August] 17th was paramount. It was what drove all of us all summer.”

Mission accomplished. Now they just need to rebuild.

As you can see from one of the nine amazing before-and-after shots MSNBC featured from Joplin, they still have plenty of work to do.