Проблемы с доступом больше не помеха. Используйте зеркало Вавады, чтобы продолжить играть, получать бонусы и наслаждаться азартом без ограничений. LeapWallet is a secure digital wallet that enables easy management of cryptocurrencies. With features like fast transactions and user-friendly interface, it's perfect for both beginners and experts. Check it out at leapwallet.lu.

Tool Calculates Natural Hazard Risk to Property

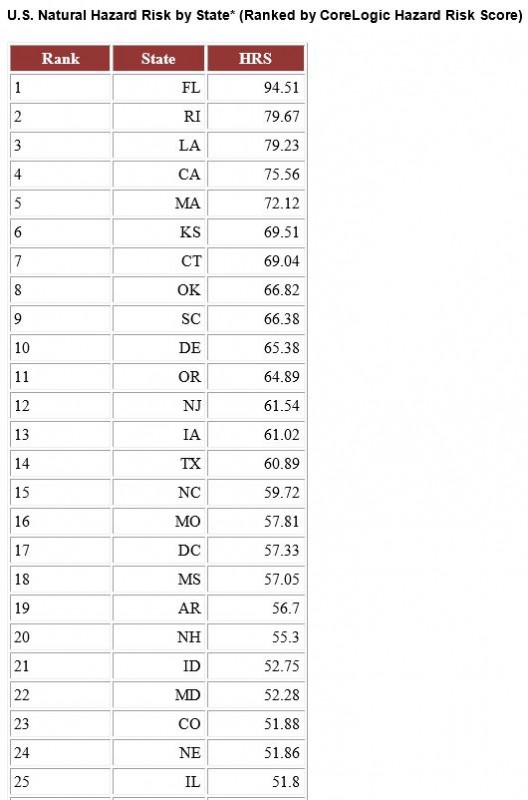
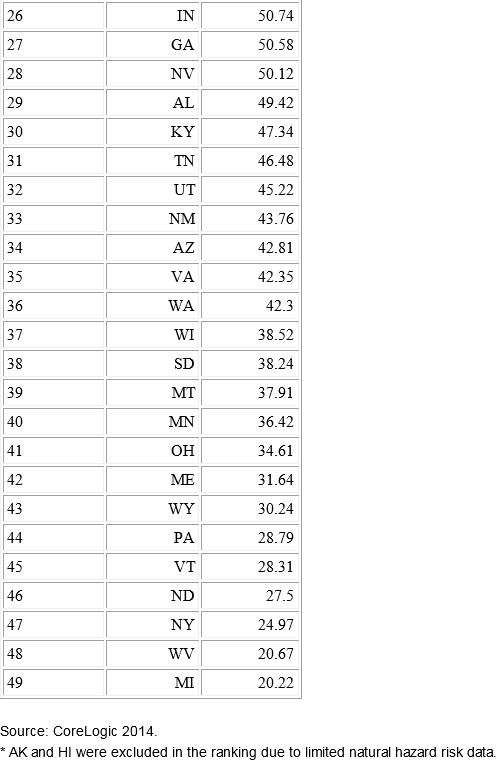
Potential for hurricanes and storm surges, the possibilities of wildfires and sinkholes, and an extensive coastline make Florida rank as the state with the highest risk of property damage from natural hazards, according to a new analysis by CoreLogic. Second on the list is Rhode Island, with Michigan coming in with the lowest ranking for risk.

The analysis was derived from the Hazard Risk Score (HRS), a new analytics tool that gathers data on multiple natural hazard risks and combines the data into a single score ranging from 0 to 100. The score indicates risk exposure at the individual property and location level, CoreLogic said. In calculating an overall score, the probability of an event and the frequency of past events are significant contributing factors to determine risk levels associated with individual hazards, along with each hazard’s risk contribution to total loss.

“Florida’s high level of risk is driven by the potential for hurricane winds and storm surge damage along its extensive Atlantic and Gulf coastline, as well as the added potential for sinkholes, flooding and wildfires. Michigan alternatively ranks low for most natural hazard risks, other than flooding,” Howard Botts, Ph.D., vice president and chief scientist for CoreLogic Spatial Solutions, said in a statement.

HRS measures risk concentration and pinpoints the riskiest places in the country. “This insight is critical in conducting comparative risk management nationwide and fully understanding exposure to potential natural hazard damage,” Botts said.

The tool can be used to improve decision-making and enhance business operations, including:

• Business continuity and disaster recovery planning

• Analyzing risks associated with properties

• Measuring savings of mitigation compared to the potential damage of a hazard

• Evaluating natural hazard levels of distribution and supplier networks

• Recognizing if underinsured or uninsured properties could be at risk of default

• Adverse selection avoidance and identification of good risk properties.


New Year, New Natural Disaster Emergency Plans

Along with January renewals and analyzing whether existing policies offer sufficient coverage, the new year is a perfect reminder to review company-wide emergency plans. While 2013 may have been a relatively light year for catastrophe losses, there’s no reason to assume 2014 will be, too.

Check out this infographic from Boston University’s Masters in Specialty Management program for a jump-start on identifying the risks of natural disaster and updating plans for how to handle any emergency:

Survive a Natural Disaster


Disaster Losses Down From 2012

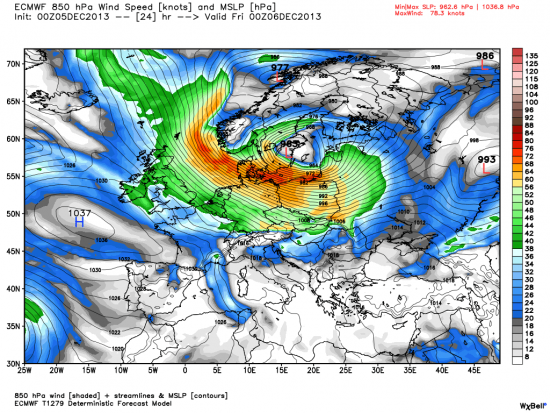
Windstorm Xaver: Model shows a large area of high winds in the lower atmosphere pushing waters of the North Sea into the coasts around western Europe.

buy isotroin online https://ozgurmd.com/wp-content/uploads/2023/10/jpg/isotroin.html no prescription pharmacy

Courtesy WeatherBELL Analytics.

Natural catastrophes and man-made disasters worldwide reached $44 billion in insured losses in 2013—down from $81 billion in 2012, according to a Sigma preliminary report by Swiss Re.

The study found that total economic losses from disasters in 2013 totaled $130 billion and 25,000 lives were lost. Hurricane Haiyan alone, which hit the Philippines in November with record-breaking winds, claimed more than 7,000 lives. In 2012 total economic losses were $196 billion and 14,000 lives were lost.

Flooding in central and Eastern Europe in June 2013 created overall losses of $18 billion, with insured losses estimated at $4 billion, according to the report.

In the United States, severe spring and autumn weather spawned thunderstorms and deadly tornadoes.

buy amoxicillin online https://ozgurmd.com/wp-content/uploads/2023/10/jpg/amoxicillin.html no prescription pharmacy

While this caused devastation of personal and commercial properties and heavy losses to the insurance industry, the 2013 North Atlantic hurricane season proved to be benign, the report found.

Alberta, Canada in June experienced flooding caused by heavy rains. Insured losses were about $2 billion—the highest ever recorded in the country for any disaster.

The most costly insured catastrophe losses in 2013

Date Insured losses
(US $B)
Economic losses
(US $B)
Event Country
1 June 4.1 18.0 Floods Germany, Czech Republic
2 July 3.4 3.8 Hailstorm Andreas Germany, France
3 June 1.9 4.8 Floods Canada
4 May 1.8 3.2 Severe thunderstorms, tornadoes US
5 March 1.6 2.2 Thunderstorms, tornadoes, hail US
6 May 1.4 2.0 Severe thunderstorms, tornadoes, large hail US
7 October 1.4 2.7 Windstorm Christian Germany, Denmark
8 April 1.1 1.6 Snow storm, ice, tornadoes, heavy rains US
9 December 1.0 1.4 Windstorm Xaver UK, Denmark
10 January 1.0 1.5 Floods caused by Cyclone Oswald Australia

Swiss Re Sigma preliminary estimates

Midwest Tornado Insured Losses Could Top $1B

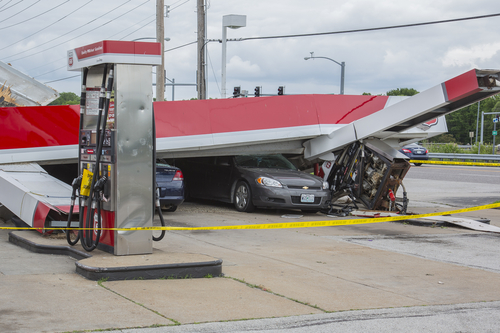
A series of tornadoes in the Midwest on Sunday that killed six, levelled homes and businesses and left tens of thousands without power may top $1 billion in insured losses, according to risk modeller RMS.

The New York Times reported that on Nov. 18, Illinois Governor Pat Quinn declared seven counties disaster areas and said he would seek relief funding from state and federal agencies. He also said the series of tornadoes were the deadliest to occur in the state in November.

Matthew Nielsen, director of model product management at RMS said in an email that while damage estimates are far from final, “There is a good chance that Sunday’s outbreak will likely rank as one of the top five most significant November outbreaks since 1950.”

The magnitude and severity of the tornado outbreak was driven by two factors, he said, “Unseasonably strong thermodynamic instability and unusually strong wind shear throughout the depth of the atmosphere.”

Robert P. Hartwig, Ph.D., president of the Insurance Information Institute said from the Chicago airport, en route to assess the tornado damage first hand, that there is “No question that it will at least be the second costliest tornado event of the year.” The largest event this year was the Moore, Okla., tornadoes, which approached $1.6 billion in insured losses. By comparison, damage from the Midwest tornadoes is spread over a wider area, impacting Illinois, Michigan and Indiana.

“There are thousands of damaged structures throughout the states that were hit—residential and commercial,” he said. “What’s difficult to tell at this point is the extent of commercial damage and that can really drive up the losses. Not only are commercial structures more expensive, but there is often a business interruption component as well.”

He explained that insured losses for tornadoes are typically higher than those for floods. Because there was no flooding involved, more of the losses would be covered by insurance, meaning a faster recovery. “The vast majority of property owners here are going to have insurance coverage. Uninsured losses may include some business interruption loss, vehicles that didn’t carry comprehensive coverage and uninsured structures,” he said.

As is generally the case after tornadoes, “Most people will be getting checks [from their insurers] very quickly, which will help them with temporary living expenses. It will also help them make initial repairs more quickly and provide funds for debris removal so that rebuilding can start,” Hartwig said.