Игроки всегда ценят удобный и стабильный доступ к играм. Для этого идеально подходит зеркало Вавады, которое позволяет обходить любые ограничения, обеспечивая доступ ко всем бонусам и слотам.

Make Your Hurricane Preparations Now

With the Atlantic hurricane season’s official start on June 1, the time to check your buildings and existing contingency plans—or start a new one—is now, during hurricane preparedness week.

For 2017, Colorado State University’s hurricane research team predicts slightly below-average activity of hurricanes making landfall, with a forecast of 11 named storms, four hurricanes, and two major hurricanes.

The 2016 season is seen as a wakeup call, as 15 named storms and seven hurricanes formed in the Atlantic Basin—the largest number since 2012. Among the hurricanes was Matthew, a Category 4, which devastated Haiti, leaving 546 dead and hundreds of thousands in need of assistance. After being downgraded to a Category 2, Matthew pummeled southeast coastal regions of the U.S., with 43 deaths reported and widespread flooding in several states.

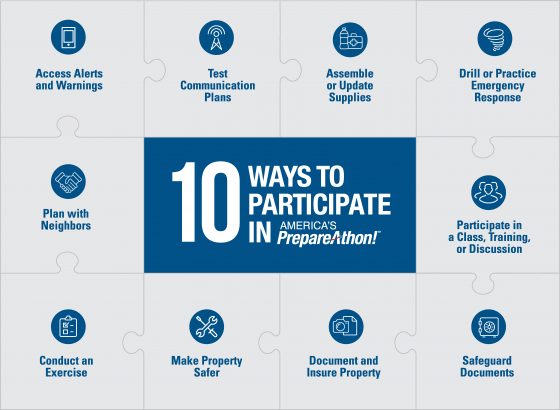
Here are 10 preparedness steps offered by FEMA:
The Insurance Institute for Business & Home Safety (IBHS) warns that small businesses are especially vulnerable. Of businesses closed because of a disaster, at least one in four never reopens.

IBHS offers these steps for preparing a business for hurricane season:

  1. Have your building(s) inspected and complete any maintenance needed to ensure your building can stand up to severe weather.
  2. Designate an employee to monitor weather reports and alert your team to the potential of severe weather.
  3. Review your business continuity plan and update as needed, including employee contact information. If you do not have a business continuity plan, consider IBHS’ free, easy-to-use business continuity plan toolkit for small businesses.
  4. Remind employees of key elements of the plan, including post-event communication procedures and work/payroll procedures. Make sure all employees have a paper copy of the plan. Review emergency shutdown and start-up procedures, such as electrical systems, with appropriate personnel, including alternates.
  5. If backup power such as a diesel generator is to be used, test your system and establish proper contracts with fuel suppliers for emergency fuel deliveries.
  6. Re-inspect and replenish emergency supplies inventory, since emergency supplies are often used during the offseason for non-emergency situations.
  7. Test all life safety equipment.
  8. Conduct training/simulation exercises for both your business continuity and emergency preparedness/response plans.

Interstate Restoration has a day-by-day list of steps for business storm preparation, based on NOAA recommendations. They include research, planning and documenting, gathering emergency supplies, checking insurance coverage and supply chain and finalizing your plan.

Disaster Losses Climb as Protection Gap Widens: Swiss Re Sigma Study

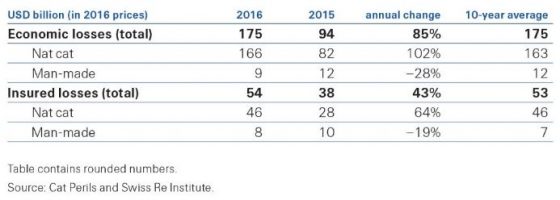
Global Economic losses from disaster events almost doubled in 2016 to $175 billion from $94 billion in 2015, according to the most recent Sigma Study from the Swiss Re Institute.

Insured losses also rose steeply to $54 billion in 2016 from $38 billion in 2015, the study found. This led to a “protection gap,” as the company calls it, of some $121 billion, the difference between economic and insured losses, a figure highly indicative of the opportunity for greater insurance penetration, according to Swiss Re. “The shortfall in insurance relative to total economic losses from all disaster events…indicates the large opportunity for insurance to help strengthen worldwide resilience against disaster events,” said the report. The gap was $56 billion in 2015.

Total economic and insured losses in 2015 and 2016:

The two headline loss figures are the highest since 2012 and end a four-year decline as the year saw a higher amount of significant disaster events including earthquakes, storms, floods and wildfires worldwide. The report noted that some events hit areas with high insurance penetration, leading to the 42% jump in insured losses.

Despite the precipitous rise in both economic and insured losses, human losses plummeted to approximately 11,000 lost or missing in 2016, down from more than 26,000 in 2015.

Of the 327 disaster events last year, 191 were natural disasters while 136 were man-made. Regionally, Asia experienced the most disaster events with 128 leading to approximately $60 billion in economic losses. Asia also had the single most costly disaster event of 2016 as the April earthquake on Kyushu Island, Japan caused an estimated $25 billion-$30 billion in economic losses.

Insured losses of $54 billion almost equaled the $53 million inflation-adjusted annual average of the past 10 years, said the report, despite being 42% higher than 2015’s $38 billion. Natural catastrophes accounted for $46 billion of insured losses, equal to the 10-year annual average, as man-made disasters led to $8 billion of insured losses, according to the report.

“In 2016, both economic and insured losses were close to their 10-year averages.
buy avana online https://royalcitydrugs.com/avana.html no prescription

Insured losses made up about 30% of total losses, with some areas faring much better because of higher insurance penetration,” Kurt Karl, Swiss Re’s chief economist said in a statement.

More than half of insured losses occurred in North America as a record number of severe convective storm events hit the region. These included an April hail storm in Texas, which caused $3.5 billion in economic loss and $3 billion in insured loss as some 86% of losses were covered. An August system brought severe storms and flooding to Louisiana, causing $10 billion in economic loss and $3.1 billion in insured loss.

The region saw several major disaster events.

buy arimidex online www.urologicalcare.com/wp-content/uploads/2023/10/jpg/arimidex.html no prescription pharmacy

In May and June, wildfires in Alberta and Saskatchewan, Canada caused $4 billion in economic losses and $2.8 billion in insured losses, Canada’s largest-ever insurance loss. The fire consumed 590,000 hectares of land and caused the evacuation of about 88,000 people. In October, hurricane Matthew, the first Category 5 storm in the North Atlantic since 2007, led to $12 billion in economic losses and $4 billion in insured losses while also, sadly, causing the greatest loss of life as 700 were lost, mainly in Haiti.

Flooding across Europe and China was also devastating at times. In May and June, severe rain and floods hit Belgium, France and parts of Germany, causing economic losses of .

buy addyi online www.urologicalcare.com/wp-content/uploads/2023/10/jpg/addyi.html no prescription pharmacy

9 billion and insured losses of .

buy zocor online www.urologicalcare.com/wp-content/uploads/2023/10/jpg/zocor.html no prescription pharmacy

9 billion. Flooding along China’s Yangtze River basin caused an estimated $22 billion in economic losses but low insurance penetration, in contrast to Europe, led to insured losses of just $400 million, according to the report.

Weather Threatens Oroville Dam Emergency Efforts

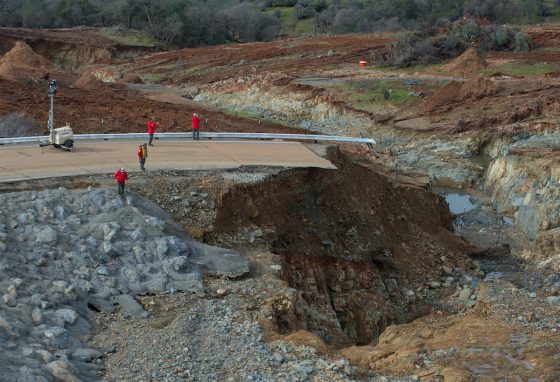
As measures are taken to repair a damaged spillway at the Oroville Dam in Northern California, weather forecasters are calling for rain later this week. Almost 200,000 people were evacuated from their homes below the dam, the largest in the country, on Feb. 12 as erosion of the dam’s emergency spillway threatened to flood the towns below.

While the situation was said to have stabilized on Sunday morning, conditions worsened and evacuation orders were issued. Roads in the area quickly backed up as a result, according to reports.

The dam’s main spillway was damaged after a winter season of record rains and snows following years of drought in the state.

Photo: California Department of Water Resources

California Representative John Garamendi told MSNBC that the evacuation was essential. “Fortunately when they were able to open the main spillway gates. That began to lower the reservoir level, because the water coming into the reservoir was about half of what they were able to expel down the main spillway, so it’s stabilized.”

The next issue, he said, is whether the spillway can be patched up “sufficiently to weather the storms that are clearly ahead of us.” Garamendi added that the months of March and April are the heavy storm season in the state.

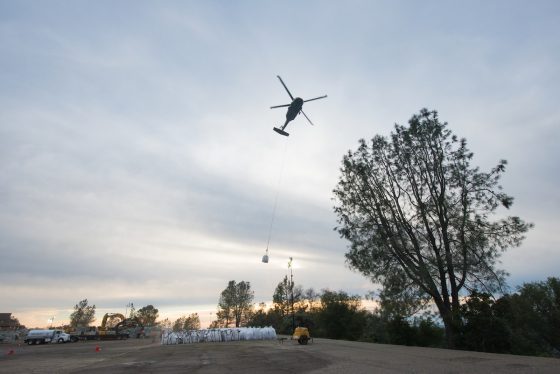
Sheriff Kory Honea of Butte County said at a press conference that the Department of Water Resources (DWR) reported that the dam’s erosion is not advancing as rapidly as they thought. He said a plan is in place to plug the hole in the spillway by dropping large bags of rocks by helicopter. The DWR said that another measure being taken to relieve pressure on the spillway has been to raise the rate of discharge water from 55,000 cubic feet per second to 100,000 cfs, which it said has been working.

Helicopters transport large bags of rocks from the Oroville Dam parking lot, to the erosion site at the Oroville Dam auxiliary spillway in California, to help fight further erosion, February 13, 2017. Oroville is in Butte County. Florence Low / California Department of Water Resources

The New York Times reported that Northern California is close to 225% above normal rainfall levels since Oct. 1. According to the Times:

Repeated rounds of rain have pounded the area in recent weeks, rapidly raising the water level at Lake Oroville, the second-largest reservoir in California and a linchpin of the state’s water system. On Tuesday, a gaping hole opened in the main spillway that is used to release extra water. Early Saturday, an adjacent emergency spillway was also put into use, the first time water flowed over it since the dam was finished in 1968, department officials said.

State officials have said the 770-foot Oroville Dam itself, the nation’s tallest, is sound.

The problems with Oroville Dam are not a surprise to some. In 2005, during a relicensing process for the dam, three environmental groups warned the DWR of potential dangers with the emergency spillway, which is not a concrete spillway, but a concrete lip with a dirt hillside below. The concern was that the hillside could be easily eroded in the case of an emergency.

The Washington Post reported:

The upgrade would have cost millions of dollars and no one wanted to foot the bill, said Ronald Stork, senior policy advocate for Friends of the River, one of the groups that filed the motion.

“When the dam is overfull, water goes over that weir and down the hillside, taking much of the hillside with it,” Stork told The Washington Post. “That causes huge amounts of havoc. There’s roads, there’s transmission lines, power lines that are potentially in the way of that water going down that auxiliary spillway.”

Federal officials, however, determined that nothing was wrong and the emergency spillway, which can handle 350,000 cubic feet of water per second, “would perform as designed” and sediment resulting from erosion would be insignificant, according to a July 2006 memo from John Onderdonk, then a senior civil engineer for the Federal Energy Regulatory Commission.

Garamendi said that “What happened with the widening of the sinkhole was the result of someone overlooking the problems, including the fact that there was no concrete apron on the spillway.”

He also noted that while there will most likely be federal dollars to help rebuild the dam, “This is just one really startling, quite tragic and potentially catastrophic example of what’s happened to the infrastructure across America. We’ve seen bridges collapse in Minnesota, we’ve seen them on I-5 in Washington State and now this reservoir, which is the linchpin of California’s water system.”

Flood, Wind Dominant Natural Hazards in 2016

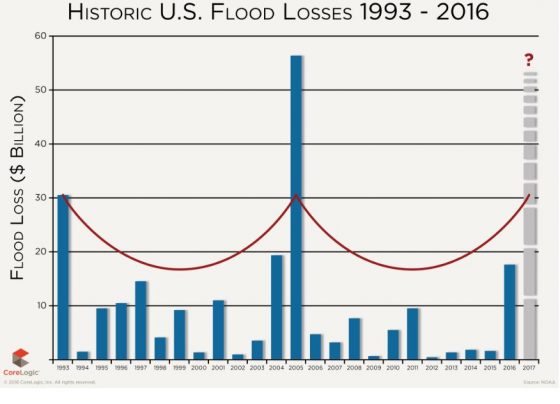
While most natural hazards occurring in the United States last year saw average or below average activity, the exceptions were flood and wind, according to the CoreLogic report Natural Hazard Risk Summary and Analysis, released today.

Severe flood events driven by substantial rainfall were the dominant natural hazards, with Louisiana and North Carolina floods being the major loss contributors. As in 2015, hurricanes and tropical storms in 2016 continued to cause inland flooding through increased and intense rainfall—even when not making landfall, according to the report.

The National Oceanic and Atmospheric Administration (NOAA) said there were 12 individual weather and climate disaster events in the U.S. with losses exceeding $1 billion in 2016.

According to the report:

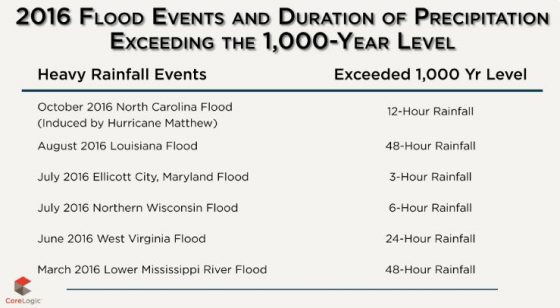
  • Based on NOAA and CoreLogic analysis, the overall flood loss in 2016, driven by six, 1,000-year plus rain events, was approximately $17 billion, which is six times greater than the overall flood damage experienced in 2015.
  • The U.S. Geological Survey (USGS) recorded 943 earthquakes of magnitude 3.0 or greater in 2016, with more than 60 percent of these earthquakes located in Oklahoma.
  • The National Interagency Fire Center (NIFC) reported a total of 5,415,121 acres burned from 62,864 separate fires in 2016.
    buy arimidex online achievephysiorehab.ca/wp-content/uploads/2023/10/jpg/arimidex.html no prescription pharmacy

    While the total acres burned in 2016 fell below the 10-year average, significant losses occurred, with thousands of homes in California and Tennessee destroyed by several smaller fires that burned in populated areas.

  • Wind activity in 2016 was slightly above average, due in large part to strong winds brought by Hurricane Matthew.
    buy mobic online achievephysiorehab.ca/wp-content/uploads/2023/10/jpg/mobic.html no prescription pharmacy

  • Hail activity in 2016 was near the average, and Texas experienced the worst of this natural hazard.
  • Tornado activity in 2016 was near average compared with previous years.
  • Hurricane Matthew developed late in the year and grew to a Category 5 storm, resulting in substantial damage along the southeastern seaboard.
  • There were below-average levels of tropical cyclone activity in the western North Pacific Basin encompassing East and Southeast Asia in 2016.

However, 2016 became known as the year without a winter. Nine winter storms impacted the U.S. in 2016, the most notable being the late-January winter storm in New York.

“History has continually shown us that it is impossible to determine exactly when or where the next wildfire, flood or earthquake will strike, which is why preparedness, response and post-loss assessment are paramount,” CoreLogic said.