Для тех, кто интересуется безопасным доступом к онлайн-играм, наш партнер предлагает зеркало Вавады, которое позволяет обходить любые блокировки и сохранять доступ ко всем функциям казино.

Tool Calculates Natural Hazard Risk to Property

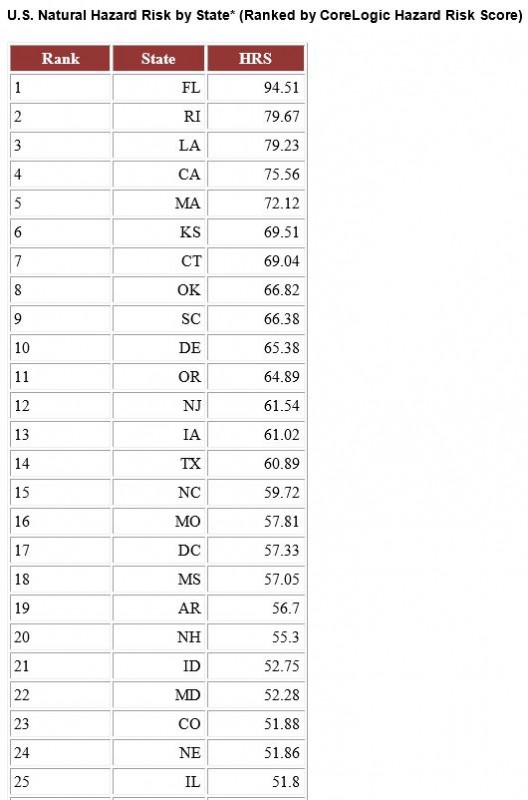
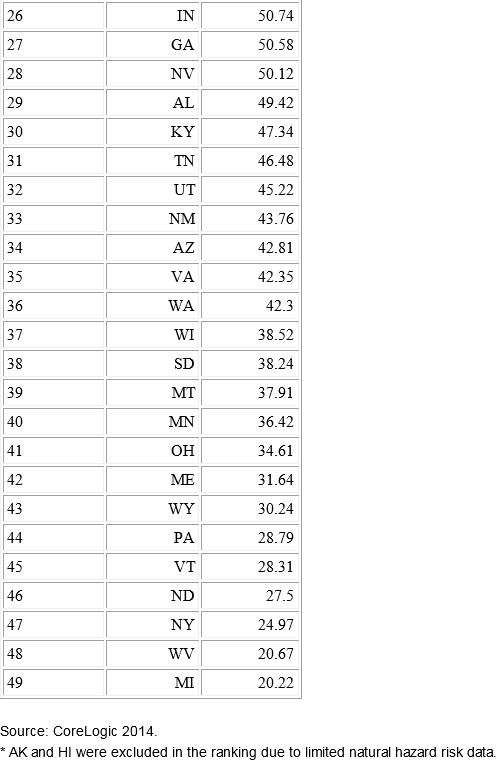
Potential for hurricanes and storm surges, the possibilities of wildfires and sinkholes, and an extensive coastline make Florida rank as the state with the highest risk of property damage from natural hazards, according to a new analysis by CoreLogic. Second on the list is Rhode Island, with Michigan coming in with the lowest ranking for risk.

The analysis was derived from the Hazard Risk Score (HRS), a new analytics tool that gathers data on multiple natural hazard risks and combines the data into a single score ranging from 0 to 100. The score indicates risk exposure at the individual property and location level, CoreLogic said. In calculating an overall score, the probability of an event and the frequency of past events are significant contributing factors to determine risk levels associated with individual hazards, along with each hazard’s risk contribution to total loss.

“Florida’s high level of risk is driven by the potential for hurricane winds and storm surge damage along its extensive Atlantic and Gulf coastline, as well as the added potential for sinkholes, flooding and wildfires. Michigan alternatively ranks low for most natural hazard risks, other than flooding,” Howard Botts, Ph.D., vice president and chief scientist for CoreLogic Spatial Solutions, said in a statement.

HRS measures risk concentration and pinpoints the riskiest places in the country. “This insight is critical in conducting comparative risk management nationwide and fully understanding exposure to potential natural hazard damage,” Botts said.

The tool can be used to improve decision-making and enhance business operations, including:

• Business continuity and disaster recovery planning

• Analyzing risks associated with properties

• Measuring savings of mitigation compared to the potential damage of a hazard

• Evaluating natural hazard levels of distribution and supplier networks

• Recognizing if underinsured or uninsured properties could be at risk of default

• Adverse selection avoidance and identification of good risk properties.


Northridge Quake Remembered

Last week was the 20-year anniversary of the Northridge Earthquake. The 6.7-magnitude event that hit on Jan.

buy flagyl online www.phamatech.com/wp-content/uploads/2023/10/jpg/flagyl.html no prescription pharmacy

buy synthroid online https://galenapharm.com/pharmacy/synthroid.html no prescription

17, 1994 at 4:30 a.m. stands as the second costliest disaster in U.S. history, following Hurricane Katrina. Northridge cost $42 billion in total damages, while Katrina cost $81 billion, according to federal figures.

The U.S. Geological Society (USGS) said that 60 people were killed, more than 7,000 injured, 20,000 were left homeless and more than 40,000 buildings were damaged in Los Angeles, Ventura, Orange and San Bernardino Counties.

The San Fernando Valley saw maximum intensities of magnitude-9 in the areas of Northridge and Sherman Oaks. Significant damage also occurred in Glendale, Santa Clarita, Santa Monica, Simi Valley, Fillmore and in western and central Los Angeles, the USGS said.

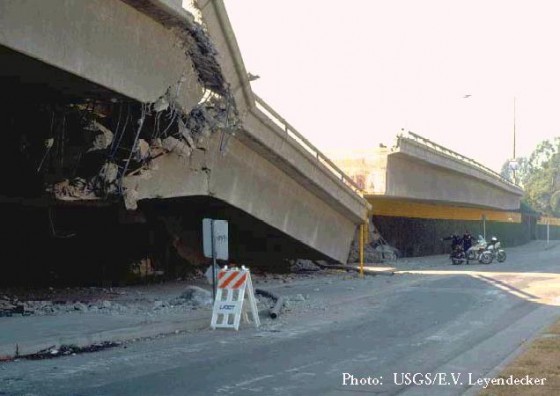
Seven freeway bridges collapsed, 212 others were damaged and 82,000 residential and commercial buildings were damaged or destroyed. About 200 steel-frame buildings suffering significant cracking, AP reported. Collapsed overpasses closed sections of the Santa Monica Freeway, the Antelope Valley Freeway, the Simi Valley Freeway and the Golden State Freeway.

The quake resulted in $12.5 billion in insurance payouts. If the event happened today, insured losses would be about $24 billion, AIR Worldwide said.

This was a significant event for me, as I was living in Los Angeles at the time. I had been living there for five years and this was my first, and hopefully last ever, earthquake experience. There had been many false alarms over the years that usually ended up being something like an extra heavy truck rumbling by. But when the real thing happened there was no question that it was, indeed, an earthquake.

Pretty much anything that could have been broken in my place was. Bookcases tumbled over sending contents everywhere. One of my sisters, who lived in Simi Valley, had every cabinet and drawer emptied by the shaking. Televisions, appliances and most furniture were ruined. Because there was no power for days and everyone in her neighborhood risked losing all their frozen food, she and her neighbors came together. They brought all of their grills and frozen food into the middle of the street where they proceeded to cook everything, supplying food for the neighborhood for days. This not only used up any food that would have otherwise spoiled, but it gave the kids a chance to run around and play with their friends and get their minds off of the terrible destruction surrounding them.

Because an earthquake is so sudden and severe, experiencing something like that is a shock to the system and takes a while to get over. Driving through L.A., I saw flattened homes, cars, apartment buildings, office buildings and parking structures.

One big success story and source of pride for Los Angeles was the Santa Monica Freeway, one of the world’s busiest, which had two areas collapse during the earthquake. It was a proud moment when freeway repairs were finished a full 74 days early. It’s a testament to what strong wills, traffic tie-ups and a large bonus will do.

The Los Angeles Times reported:

Spurred by the promise of an extra $200,000 a day for every day work was completed ahead of schedule, the contractor, C. C. Myers Inc., will finish the project 74 days before a June 24 deadline and rack up a $14.5-million bonus for the company.

The high-speed construction was made possible by crews working around the clock, seven days a week, and by state officials cutting through red tape.

“This freeway, with its broken bridges, broken connectors, became one of the most visible signs of the devastation brought upon Los Angeles by the Northridge earthquake,” Gov. Pete Wilson said during a news conference at the freeway.

buy anafranil online www.phamatech.com/wp-content/uploads/2023/10/jpg/anafranil.html no prescription pharmacy

“Now its rebuilding and its reopening . . . will serve as one of the . . . symbols of the energy of this great community.”

In Sacramento, Caltrans Director James van Loben Sels estimated that without the accelerated effort the project would probably have taken two years to complete.

But the acceleration did not come without cost. With the bonuses given to C. C. Myers, the price tag on the project rose from the original bid of .

buy zoloft online www.phamatech.com/wp-content/uploads/2023/10/jpg/zoloft.html no prescription pharmacy

9 million to nearly $30 million.

New Year, New Natural Disaster Emergency Plans

Along with January renewals and analyzing whether existing policies offer sufficient coverage, the new year is a perfect reminder to review company-wide emergency plans. While 2013 may have been a relatively light year for catastrophe losses, there’s no reason to assume 2014 will be, too.

Check out this infographic from Boston University’s Masters in Specialty Management program for a jump-start on identifying the risks of natural disaster and updating plans for how to handle any emergency:

Survive a Natural Disaster


Disaster Losses Down From 2012

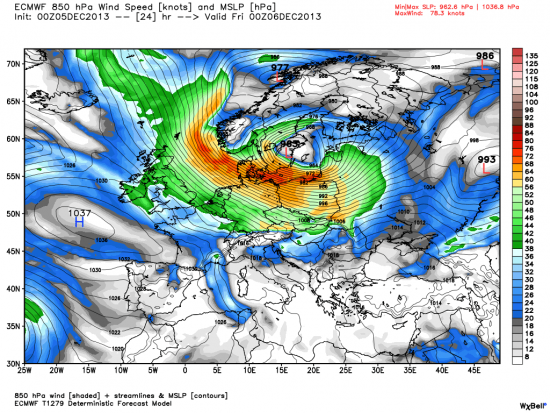
Windstorm Xaver: Model shows a large area of high winds in the lower atmosphere pushing waters of the North Sea into the coasts around western Europe.

buy isotroin online https://ozgurmd.com/wp-content/uploads/2023/10/jpg/isotroin.html no prescription pharmacy

Courtesy WeatherBELL Analytics.

Natural catastrophes and man-made disasters worldwide reached $44 billion in insured losses in 2013—down from $81 billion in 2012, according to a Sigma preliminary report by Swiss Re.

The study found that total economic losses from disasters in 2013 totaled $130 billion and 25,000 lives were lost. Hurricane Haiyan alone, which hit the Philippines in November with record-breaking winds, claimed more than 7,000 lives. In 2012 total economic losses were $196 billion and 14,000 lives were lost.

Flooding in central and Eastern Europe in June 2013 created overall losses of $18 billion, with insured losses estimated at $4 billion, according to the report.

In the United States, severe spring and autumn weather spawned thunderstorms and deadly tornadoes.

buy amoxicillin online https://ozgurmd.com/wp-content/uploads/2023/10/jpg/amoxicillin.html no prescription pharmacy

While this caused devastation of personal and commercial properties and heavy losses to the insurance industry, the 2013 North Atlantic hurricane season proved to be benign, the report found.

Alberta, Canada in June experienced flooding caused by heavy rains. Insured losses were about $2 billion—the highest ever recorded in the country for any disaster.

The most costly insured catastrophe losses in 2013

Date Insured losses
(US $B)
Economic losses
(US $B)
Event Country
1 June 4.1 18.0 Floods Germany, Czech Republic
2 July 3.4 3.8 Hailstorm Andreas Germany, France
3 June 1.9 4.8 Floods Canada
4 May 1.8 3.2 Severe thunderstorms, tornadoes US
5 March 1.6 2.2 Thunderstorms, tornadoes, hail US
6 May 1.4 2.0 Severe thunderstorms, tornadoes, large hail US
7 October 1.4 2.7 Windstorm Christian Germany, Denmark
8 April 1.1 1.6 Snow storm, ice, tornadoes, heavy rains US
9 December 1.0 1.4 Windstorm Xaver UK, Denmark
10 January 1.0 1.5 Floods caused by Cyclone Oswald Australia

Swiss Re Sigma preliminary estimates