Для тех, кто интересуется безопасным доступом к онлайн-играм, наш партнер предлагает зеркало Вавады, которое позволяет обходить любые блокировки и сохранять доступ ко всем функциям казино.

Super Bowl Prop Bets and Monte Carlo Simulation

This Sunday, the Denver Broncos and Seattle Seahawks will square off in Super Bowl XLVIII. For many fans, making a wager of some sort—such as betting on the point spread, the over-under, a family/office pool, etc.—is a part of the experience. Most bets are relatively straightforward; however, if you’ve ever been to Las Vegas to watch the big game, you’ll find Super Bowl wagers are taken to an entirely different—and more complex—level. In addition to traditional wagers, you’ll find an almost unlimited number of proposition—or “prop”—bets that can stray into more peripheral aspects of the game.  Consider the following prop bets from last year’s Super Bowl between the Ravens and 49ers:

  • Who will win Super Bowl MVP? (Winning bet: Ravens’ QB Joe Flacco at 11/4 odds)
  • What color will the Gatorade (or liquid) be that is dumped on the winning coach? (Winning bet: Clear/water at 7/4 odds)
  • Will Alicia Keys’ rendition of the national anthem be over/under 2:15? (Winning bet: Over, at 2:42)

One of the more talked-about on-the-field wagers of this year’s game centers around how many touchdown passes Broncos quarterback Peyton Manning will throw against the Seahawks vaunted defense. During the regular season, Manning set single-season NFL records for touchdown passes (55) and passing yards (5,477) and led Denver to 603 regular season points, which is also a record. Countering that attack will be the Seahawks, which featured the league’s stingiest defense. Here’s a comparison of Manning and the Seahawks’ per-game passing stats:


Manning

Seahawks

 Passing yards/game : 342.3  Passing yards allowed/game:  172
 Passing TDs/game: 3.4  Passing TDs allowed/game: 1


“If you really spend your time on it, I think you can make money on prop bets,” says Dr. Wayne Winston,  a professor of operations and decision technologies at the University of Houston Bauer College of Business and a nationally respected sports probabilities expert.  On his website, Winston offers a variety of sports probabilities, and he’s even written a book, Mathletics: How Gamblers, Managers, and Sports Enthusiasts Use Mathematics in Baseball, Basketball, and Football, that breaks down how probabilities are utilized in athletics.

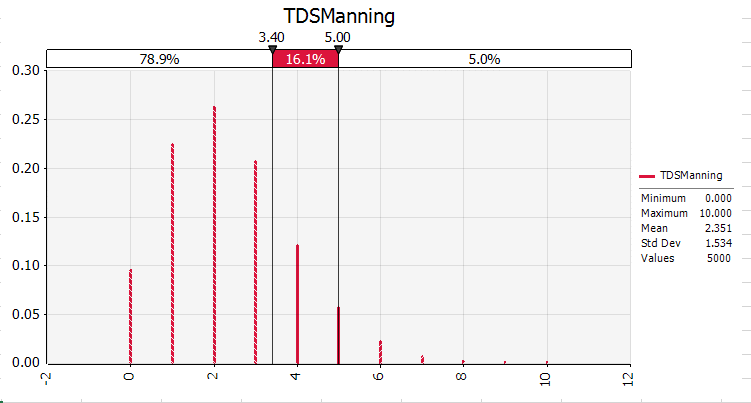
So how many touchdowns will Manning throw in the Super Bowl? Las Vegas has its opinion, and Winston—who ran 10,000 simulations using Monte Carlo simulation—has his. As the table below indicates, Winston and Vegas agree most closely on whether or not Manning will throw zero or one touchdown pass. However, the gap widens—with Winston having less confidence in Manning—when calculating the possibility of two, three or four TD passes.


Manning Super Bowl TD passes Winston’s Estimate Vegas’ Estimate
0 9.53% 9.09%
1 22.40% 22.22%
2 26.33% 33.33%
3 20.63% 28.57%
4 12.12% 18.18%
5 or more 8.70% 9.09%


Obviously, such predictions aren’t an exact science, but it is interesting to see how probabilities can differ, based on the data inputs utilized. And if your inputs are better than Vegas, then you may stand a chance to come out ahead. That said, Winston hasn’t determined how many times Manning will utter the phrase “Omaha” at the line of scrimmage on Sunday. Not surprisingly, Vegas has considered it, and has the over/under at 27.5.

Widening Wealth Gap Is Biggest Global Risk, World Economic Forum Predicts

Wealth Disparity

According to the World Economic Forum’s Global Risks 2014 report, the chronic gap between the incomes of the richest and poorest citizens is the risk most likely to cause serious global damage in the next decade. Looking forward, the 700 experts queried emphasized that the next generation will only feel this disparity more acutely if current conditions continue. Those presently coming of age face “twin challenges” of reduced employment opportunity and rising education costs, prompting the World Economic Forum to consider the impact on political and social stability as well as economic development.

“Many young people today face an uphill battle,” explained David Cole, group chief risk officer of Swiss Re. “As a result of the financial crisis and globalization, the younger generation in the mature markets struggle with ever fewer job opportunities and the need to support an aging population. While in the emerging markets there are more jobs to be had, the workforce does not yet possess the broad based skill-sets necessary to satisfy demand. It’s vital we sit down with young people now and begin planning solutions aimed at creating fit-for-purpose educational systems, functional job-markets, efficient skills exchanges and the sustainable future we all depend on.”

After a widening global wealth gap, experts predicted that extreme weather events will be the global risk next most likely to cause systemic shock on a global scale. They identified fiscal crises as the global risk with the potential to have the biggest impact over the next 10 years.

The top five most likely and most potentially impactful global risks are:

Most Likely Risks

1. Income disparity (societal risk)

2. Extreme weather events (environmental risk)

3. Unemployment and underemployment (economic risk)

4. Climate change (environmental risk)

5. Cyberattacks (technological risk)


Most Potentially Impactful Risks

1. Fiscal crises (economic risk)

2. Climate change (environmental risk)

3. Water crises (environmental risk)

4. Unemployment and underemployment (economic risk)

5. Critical information infrastructure breakdown(technological risk)

The New Reality of Risk

In wondering what the new year has in store for the insurance industry, Marsh hosted “The New Reality of Risk – U.S. Insurance Markets and Risk Trends in 2013,” a webinar produced on the heels of their Insurance Market Report 2013 publication. The webinar touched on firming in the market, Superstorm Sandy, cat models and workers comp, among other things, with insights from:

  • Dean Klisura, U.S. risk practices leader for Marsh
  • Cliff Rich, managing director in Guy Carpenter’s global business intelligence unit
  • Duncan Ellis, Marsh’s U.S. property practice leader
  • Jon Zaffino, Marsh’s U.S. casualty practice leader
  • Chris Lang, U.S. placement leader for Marsh’s FINPRO practice
  • Claude Yoder, head of Marsh global analytics

Catastrophe Market

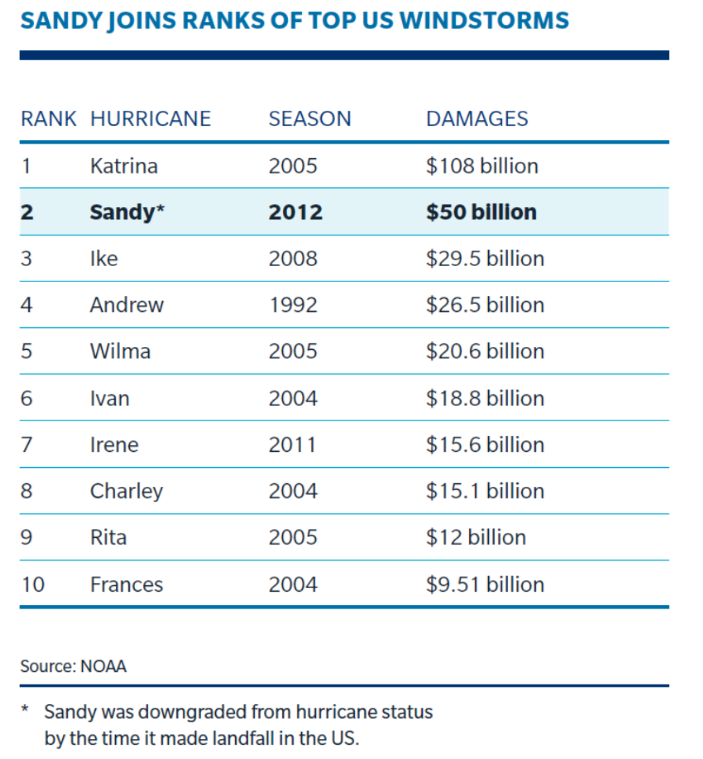
“One thing we have seen change dramatically in the past two years relates to cat losses,” said Klisura. As he noted, insured losses over the past 10 years have averaged $50 billion, with a spike in 2011. The industry has experienced two straight years of well above average losses — coupled with feeling the effects of low interest rates and a shaky economy. “However, the industry still remains well capitalized,” Klisura remarked.

Klisura doesn’t envision a hardening environment, but claims certain sectors of the market are in transition. “A few things risk managers should keep an eye on in 2013 are cat exposed property risk, including risk with flood zone exposures — it will be a big one,” said Klisura. He also noted that certain sectors of workers comp market will may experience changes along with complex financial institution risk and competition among insurers, which is expected to remain intense in 2013.

Reinsurance

The reinsurance market at January 1 was characterized as stable. Superstorm Sandy, crop losses and other severe weather outbreaks resulted in global losses of $60 billion, which was less than 2011 losses, but the sector continues to be challenged by the macroeconomic environment — namely, the economy. “Casualty rates increased modestly in 2012 but at January 1, 2013, renewal rates, casualty pricing stabilized,” said Cliff Rich.

Cat Limits

According to the panelists, carriers are being a little more stingy around cat limits. For cat sub limits, they are seeing carriers limiting the amount of flood coverage. For deductibles, they’re seeing a push for per-location deductibles on flood vs traditional per-occurrence deductibles. For premiums, there is renewed pressure on some cat exposed insureds and on a client by client basis. “For 2013, I think it’s much of the same we’ve seen,” said Ellis. “2012 could be the third year in a row that property insurers have not realized a profit. The big unknown? 2013 losses.” There is a potential for “trading” between retention and premium, he explained.

Cat Models

In terms of catastrophe models, Ellis feels they will change to take into account both Irene, which had insured losses of $4.4 billion, and Sandy, which had insured losses of $18 to $25 billion. This drives home the point that insureds should provide high quality data for models. “What I’ve heard is that losses from Sandy are what was expected from modeling,” Ellis said. “But models will change.”

There are several widely used models for wind and earthquake, Ellis pointed out. But that’s not the case with flood, despite flooding being the loss leading peril over the last few years. “There’s nothing consistent market-wide yet,” he said.

Casualty Market 

Jon Zaffino explained that insurer competition is strong. However, challenges may arise from clients with difficult loss experience and certain individual risks, or line of business characteristics. “It’s a tug of war between the technical and trading environment,” he said. “We may see rates flattening in some lines in 2nd half of 2013.”

  • Technical – macro factors such as loos-cost trend, interest rates, etc.
  • Trading – insurance supply/insurer appetite and market depth and breadth

Workers Comp

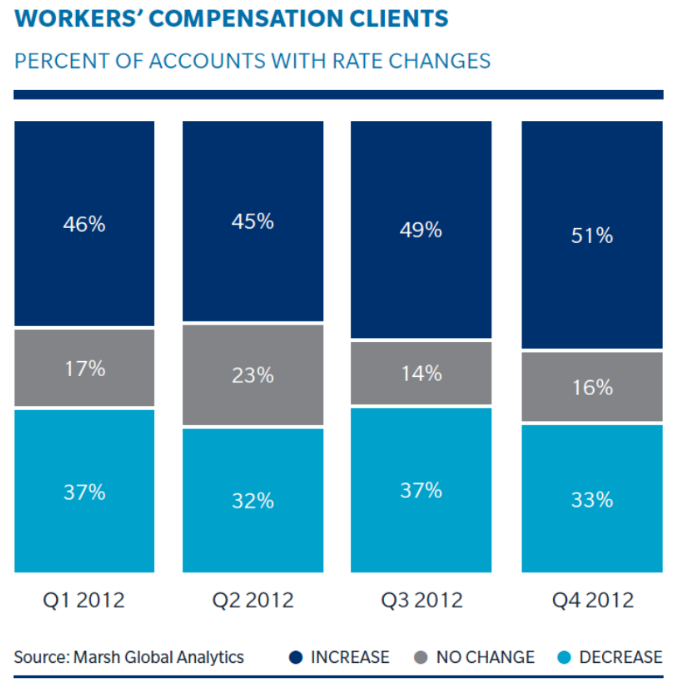
This segment continues to operate at historically unprofitable rates for insurers. Marsh illustrates this with a graphic based on their client accounts.

“Medical expenses as a percentage of toal claims continues to rise, along with the escalation of prescribtion drug use and abuse,” said Zaffino.” Active pre- and post-loss programs, medical cost containment measures and a variety of other technigues help clients manage their claims.

“The largest trend we’re really seeing in casualty is the need to create a comprehensive view of total cost of risk, or TCOR,” said Yoder. “For workers comp, there is much available data, advances in the way insurers calibrate their underwriting and pricing, and a wave of claims-based modeling. Plus, predictive analytics use in claims modeling is accelerating.”

Directors and Officers 

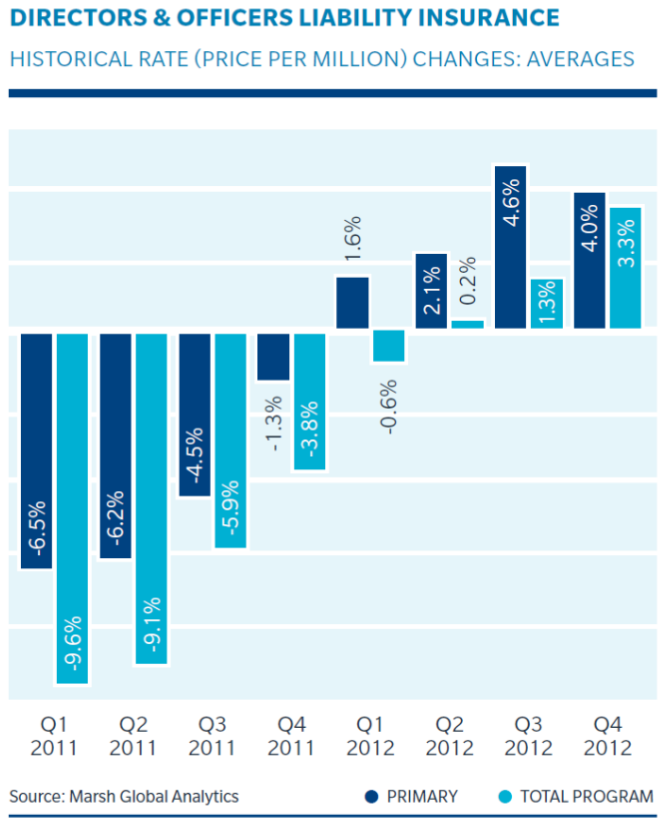
According to Chris Lang, rates in the management liability market are trending upward. As 2012 progressed, leading insueres obtained upwards of 10% increases, and average program rate increases of 5%. “Smaller sized market companies are experiencing higher rate increases than are larger companies,” said Lang. “In 2013, expect insurers’ rate discipline to continue.”

Regulatory actions are increasing. According to NERA, in 2012, settlements rose 6.6% compared with 2011, to 714.


The Insurance Industry Needs More Dynamic Models

Simpler, but more dynamic capital models are what the insurance industry needs in order to avoid suffering some of the same problems it did during the financial crisis that began in 2008, according to the Willis Economic Capital Forum (WECF), a Georgia-State-University-based initiative from the academic and analysis arm of Willis Group.

Markus Stricker, director of the WECF, said in a statement that “everyone in the industry would be interested in reducing the complexity of models, making things more transparent and thus easier to understand. We ought to have learnt in the years since the financial crisis that our economic capital models need to be more dynamic and more insightful.”

He went on, explaining that looking at economic capital models in a static manner is not very helpful. Instead, he suggests insurers develop models that are simpler, yet still useful and easier to use. Stricker suggests learning from other industries that have such models in place.

For example, airplane manufacturers run stress tests to find out how much pressure they can put on a wing before it breaks off, while pharmaceutical companies have a rigorous, structured process they must go through to get a medication validated.

“I think we need a similar set of standard procedures to validate the methods that financial companies use to calculate solvency related key figures,” said Stricker. Currently, standardized processes do not exist for validating economic capital models.

buy suhagra online https://silvermancare.com/wp-content/uploads/2023/10/jpg/suhagra.html no prescription pharmacy

It seems insurance companies, regulators and brokers could all benefit from a validation process that is transparent and efficient.