Want to scan your crypto wallet for risks? Check: AML check BTC, USDT, ETH. Checking cryptocurrency wallets for dirty money. You may not be aware of a risky transaction and at any moment, even can increase your AML rating into the red zone.

Annual Report Card Finds Vermont Has the Best Insurance Regulatory System

Examining a matrix of variables affecting a state’s insurance regulations, the R Street Institute determined that Vermont has the best regulatory system for insurance and that vermontNorth Carolina has the worst, according to the Insurance Regulation Report Card.

The annual report grades each state across seven dimensions. The three fundamental questions the report seeks to answer are:

1. How free are consumers to choose the insurance products they want?

2. How free are insurers to provide the insurance products consumers want?

3. How effectively are states discharging their duties to monitor insurer solvency and foster competitive, private insurance markets?

“We believe states should regulate only those market activities where government is best-positioned to act; that they should do so competently and with measurable results; and that their activities should lay the minimum possible financial burden on policyholders, companies and, ultimately, taxpayers,” Senior Fellow R.J. Lehmann said in a statement.

According to the report:

The insurance market is both the largest and most significant portion of the financial services industry to be regulated almost entirely at the state level. While state banking and securities regulators largely have been preempted by federal law in recent decades, Congress reserved to the states the duty of overseeing the “business of insurance” as part of 1945’s McCarran-Ferguson Act. On balance, we believe states have done an effective job of encouraging competition and, at least since the broad adoption of risk-based capital requirements, of ensuring solvency. As a whole and in most individual states, U.S. personal lines markets are not overly concentrated. Insolvencies are relatively rare and, through the runoff process and guaranty fund protections enacted in nearly every state, generally quite manageable. However, there are certainly ways in which the thicket of state-by-state regulations leads to inefficiencies, as well as particular state policies that have the effect of discouraging capital formation, stifling competition and concentrating risk. Central among these are rate controls.

For the third straight year, the report found that Vermont had the best insurance regulatory environment in the United States, receiving the only A+ score. Other states receiving either an A or A- were Arizona, Idaho, Illinois, Kentucky, Maine, New Hampshire, Utah and Wisconsin.

Meanwhile, North Carolina had the worst score, receiving a failing grade for the third year in a row. States ranking a D include Alaska, Massachusetts, California, Hawaii, Louisiana, Mississippi, Delaware, Montana, North Dakota and New York.

R Street found the most significant shift to be the continued expansion of North Carolina’s two property insurance residual market entities, even as Florida’s Citizens Property Insurance Corp.—previously the nation’s largest residual market entity—has continued to shrink.

“Not coincidentally, when R Street issued its first regulation report card in 2012, Florida ranked dead last and North Carolina was somewhere in the middle. This year, North Carolina is dead last and Florida is somewhere in the middle,” Lehmann wrote.

Driver Data: Advances in Innovative Exchange

With an innovation worthy of the digital age, the field of vehicle telematics is bringing auto manufacturers and insurance companies into sharper alignment. Now, data recorded in an individual vehicle can be “crunched” to yield insightstelematics 
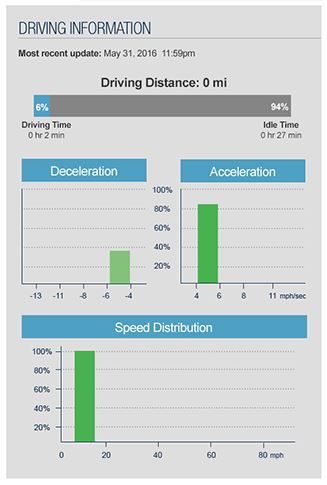
about driving behavior—insights that can shed light on a driver’s risk category. In a further innovation, 2016 brought the establishment of a telematics data exchange, enabling risk managers to make use of this data with the consent of drivers.

Telematics data can potentially benefit consumers, fleet owners and insurers. Instead of insurers generally relying on a driver’s general information—age or gender, for example—policies can be written to address specific levels of risk supported by actual driving data (speed, acceleration, braking and time of operation).
buy prelone online https://royalcitydrugs.com/prelone.html no prescription

So the elements are falling into place to tap telematics-derived data, with potential for also attaining higher fuel efficiency and better fleet vehicle performance.

How do consumers and fleet owners benefit?

buy rybelsus online www.phamatech.com/wp-content/uploads/2023/10/jpg/rybelsus.html no prescription pharmacy

  • Rewards: Discounted insurance for drivers who have fewer risks or lower annual miles
  • Ease: Greater convenience, flexibility, and portability when shopping for auto insurance
  • Safety: Promotion of good driving habits
  • Savings: Insurers’ enhanced ability to segment risk types, potentially lowering premium costs for commercial fleet owners and managers

History of an idea

The seed for telematics was planted in the early 1960s, during a period when tensions between the United States and the former Soviet Union were escalating. That is also when the U.S. government, intent on national security and concerned about a potential nuclear threat, funded development of Global Positioning System (GPS) technology. Initially, GPS was intended for military and intelligence applications. By the early 2000s, telematics technologies were used in web-based fleet management systems that featured real-time information updates to remote networks. At that time, slow tracking rates limited data transmissions to one or two instances per hour. It wasn’t long, however, before GPS-based vehicle navigation systems flooded the consumer market.

Aligning value

In recent years, telematics has brought auto manufacturers and insurers into alignment, with both industries recognizing the potential of telematics. Automakers have found value in using telematics data to communicate information to car owners about their vehicle’s maintenance needs and performance and to convey information to consumers about their driving behavior, which could lead to safer driving. In turn, safer driving—such as fewer sharp turns and hard-braking incidents—could positively affect vehicle performance and fuel efficiency. And insurers have found a means to help better define risks.

Automakers also recognized that better fuel efficiency and less wear and tear (requiring less maintenance) could potentially save money for consumers, thereby reducing the total cost of car ownership.

Many insurers, too, quickly saw the inherent value of telematics data. Traditionally, insurers rate consumers on various factors that typically include proxy data to predict an individual’s risk level, which helps determine rates. Some consumers may complain that not enough insight goes into the rating process. Yet telematics data, applied through usage-based insurance (UBI) programs, allows insurers to consider details of individual driving behavior—which might lead to more accurate and customized pricing. Insurance rating could become more focused on individual behavior and performance. Insurers understand that a benefit of using telematics data as part of their underwriting practices can include the consumer’s perception that carriers are operating with greater transparency—and potentially give consumers greater understanding of their auto insurance expenses.

Consumers could now examine their own driving data—and likely this data overlapped with the data their insurance company reviewed when establishing their rate in the first place.

Great leap forward

For some time, we’ve said that a telematics data exchange might represent the future of usage-based insurance. That future isn’t far away. Consider this: It is estimated that by 2020, more than 90% of all new vehicles sold in the United States will be able to connect to the internet. Today, about 5% of vehicles are so equipped. That is a powerful leap forward in terms of the data that will be available from connected cars.

This gives auto-makers the potential to capitalize on vast amounts of data collected by the connected cars they sell. Insurers can benefit by potentially enhancing their efforts to acquire and retain safer drivers and monitor their policyholders’ driving behavior and vehicle mileage.

buy desyrel online www.phamatech.com/wp-content/uploads/2023/10/jpg/desyrel.html no prescription pharmacy

There can be corresponding challenges related to such connected vehicle data, however. The volume of data from connected cars is enormous and growing. The hardware, software, and carrying costs needed to store and manage that data can run into the millions of dollars—a cost many insurers may find onerous.

buy clomiphene online www.phamatech.com/wp-content/uploads/2023/10/jpg/clomiphene.html no prescription pharmacy

Automakers face their own set of issues, chief among them being the “many-to-many” problem: how to connect with hundreds of insurers that might be interested in accessing their data. While those are just a few of the multiple hurdles to overcome when harvesting exponentially growing stores of data, these are challenges that a telematics data exchange can help address. That is why the launch of the first data exchange marks such a critical milestone in the history of telematics.

Lloyd’s Finds Extreme Weather Can Be Accurately Modeled Independently

In a new report based on research from UK national weather service the Met Office, Lloyd’s has found that extreme weather events may be modeled independently. While extreme weather can be related to events within a region, these perils are not significant correlated with perils in other regions of the world.

The study’s key findings include:

  • Met Office research found that the majority of perils are not significantly correlated, but identified nine noteworthy peril-to-peril teleconnections, most of which are negatively correlated
  • Lloyds’ modeling finds that these correlations were not substantial enough to warrant changes to the amount of capital it holds to cover extreme weather claims
  • Even when there is some correlation between weather patterns, it does not necessarily follow that there will be large insurance losses. Extreme weather events may still occur simultaneously even if there is no link between them
  • An assumption of independence for capital-holding purposes is therefore appropriate for the key risks the Lloyd’s market currently insures
  • The methodology released in the report enables scenario modeling across global portfolios for appropriate region-perils

“This important finding supports the broader argument that the global reinsurance industry’s practice of pooling risks in multiple regions is capital efficient and that modeling appropriate region perils as independent is reasonable,” the report concluded.

According to Trevor Maynard, head of exposure management and reinsurance at Lloyd’s, “This challenges the increasingly held view among some regulators around the world that capital for local risks should be held in their own jurisdictions. Lloyd’s believes this approach reduces the capital efficiency of the (re)insurance market by ignoring the diversification benefits provided by writing different risks in different locations and, in so doing, needlessly increases costs, to the ultimate detriment of policyholders. Insisting on the fragmentation of capital is not in the best interests of policyholders.”

Check out the map below for further insight from the Met Office about large-scale weather perils that do demonstrate statistically significant correlation:

lloyd's extreme weather perils

November Composite Rate -1%, Up From -2% in October

The November composite rate for insurers in the United States moved from minus 2% to minus 1% in November, with commercial insurance seeing the largest increases, barometer
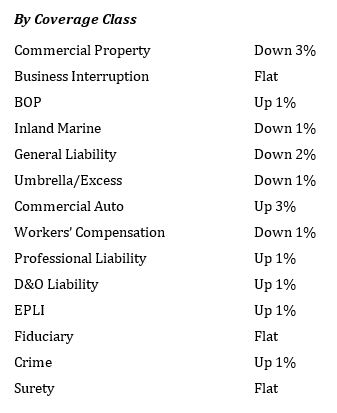
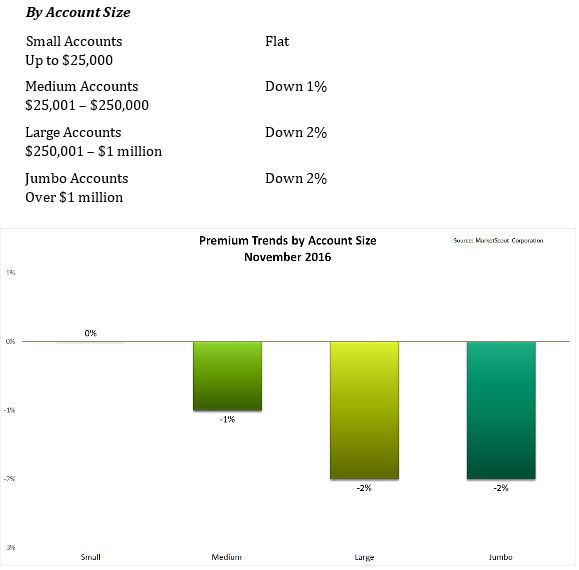
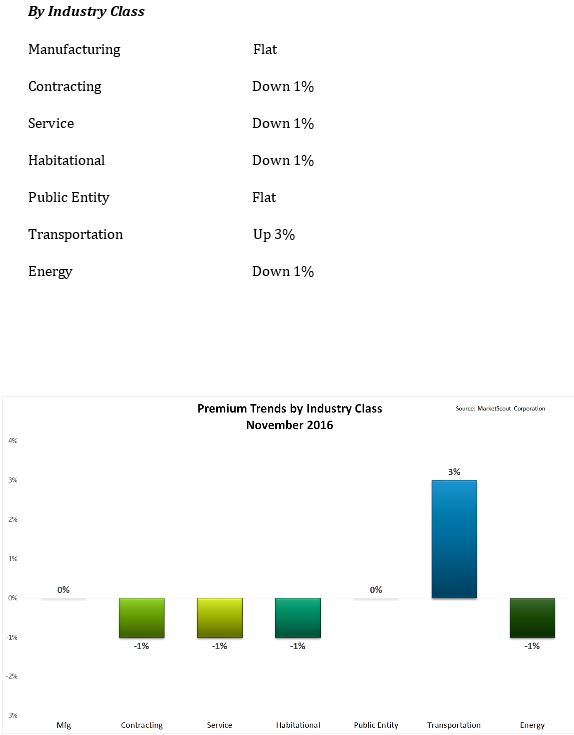
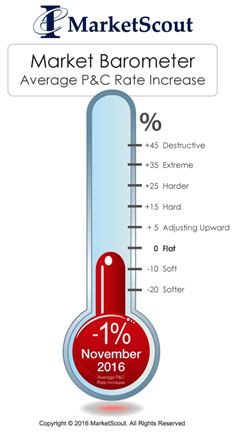
according to MarketScout.

“The most notable coverage classification with an ongoing consistent rate increase is commercial auto at plus 3%,” said MarketScout CEO Richard Kerr. “The commercial auto classification includes all types of commercial vehicles. Not surprisingly, the most notable industry classification with an ongoing consistent rate increase was transportation, also at plus 3%.”

The transportation classification includes trucking, hauling, buses, “and most anything with wheels,” he said. Railroads and aviation are not included in the transportation class.

“Underwriters have long struggled with commercial auto, many writing the coverage only to capture the related casualty lines such as workers compensation, general liability and excess. Many insurers consider commercial auto as a loss leader,” Kerr said.

By coverage classification, from October to November, property was down from minus 2% to minus 3%, business owners policies (BOPs) were up 1% compared to down 1%, auto was up 3% from up 2% and D&O was up 1% from flat.

coverage-1

By premium size, small accounts (up to $25,000) were flat in November compared to down 1% in October. Medium accounts ($25,001 to $250,000) were down 1% in November compared to down 2% in October. Large accounts ($250,001 to $1,000) saw more aggressive pricing, with rates down more in November (minus 2%) compared to October (minus 1%). Jumbo accounts (over $1 million) remained stable at minus 2%.
account-size-2

Insurers reversed their rate reductions for the contracting and service industries, moderating rate reductions from minus 2% in October to minus 1% in November. Manufacturing rates were flat in November compared to down 1% in October, MarketScout said.
industry-class-3