RIMS Risk Maturity Model: ERM Approach and Process Management

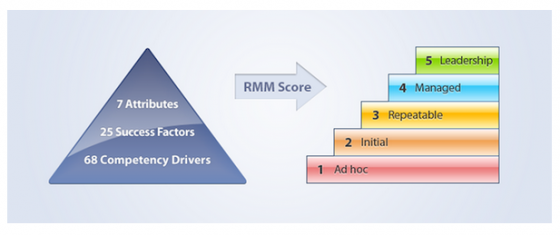
Last week, we introduced the latest findings from studies of the RIMS Risk Maturity Model. In an effort to explain the model and results of the study more fully, it’s beneficial to break the RMM into each of its attributes. Here we’ll examine the first two attributes of an effective ERM program, ERM Based Approach and ERM Process Management.

ERM Based Approach

The emphasis of this attribute is to move organizations from an old, obsolete style of governance to a more holistic, integrated approach. Old-style governance is focused on regulatory compliance and silo specific risk management. The problem with this approach is it leaves the organization exposed to risk that isn’t governed by regulatory mandates, as well as cross functional risk that may be systemic to the company.

We see examples of failures in this approach all the time. West Virginia’s water contamination crisis, for example, was caused by a series of risks with inadequate controls—the chemical tank was not adequately surveyed, the employees were not directed to immediately report the leak, even the water filtration organization wrongly estimated that it could filter the chemicals out. None of these entities were at fault from a regulatory perspective, but they were still on the hook for millions in remediation (the chemical plant filed for Chapter 11 bankruptcy in January).

buy rybelsus online abucm.org/assets/jpg/rybelsus.html no prescription pharmacy

An ERM approach moves organizations past regulatory concerns, which are only a subset of the overall risk universe. This requires a number of activities that the Risk Maturity Model identifies as drivers of ERM Maturity—tone from the top, assimilation into front line activities, risk ownership—which when combined result in a more risk-aware enterprise.

RIMS Risk Maturity Model: ERM Process Management

With a new governance mindset in place, organizations can move to applying a risk-based process framework of Identify, Assess, Evaluate, Mitigate and Monitor within each business process.

The RMM assesses the degree to which these activities are pervasive inside business processes. Many executives misinterpret these processes as unique to ERM, when in fact the steps are iterative, constantly reoccurring within organizations but without any defined process or standardizations.

buy amaryl online abucm.org/assets/jpg/amaryl.html no prescription pharmacy

The key to ERM process management is to create a common language and structure so areas can better transfer knowledge to each other where beneficial.  This is done by integrating these framework steps into the business in a way that provides accountability, repeatability, and adequate reporting. A great example is the Vendor Management Governance function. Vendor management is frequently tasked with identifying critical vendors, assessing their risk (such as “due diligence”) and then managing through mitigation (contracts, insurance certificates) and monitoring (shipping times, order completion).

The problem is that vendor management, like other functions, is operating independently with too little information exchanged between vendor management and other governance functions.

Why is this important?

Strategic imperatives are by nature cross-functional, but are rarely linked to processes and activities on the front line. When not linked, risks to corporate objectives are either not addressed or treated differently by the business processes. This alignment is a critical driver of ERM maturity. Organizations that can effectively communicate goals—not just at the corporate level, but down to the front lines—are better equipped to achieve results and elevate concerns.

buy lasix online abucm.org/assets/jpg/lasix.html no prescription pharmacy

Interested in seeing how this approach differs from traditional governance? Watch our short video on Strategic Risk Management.

Lessons Learned from Winter’s Wrath

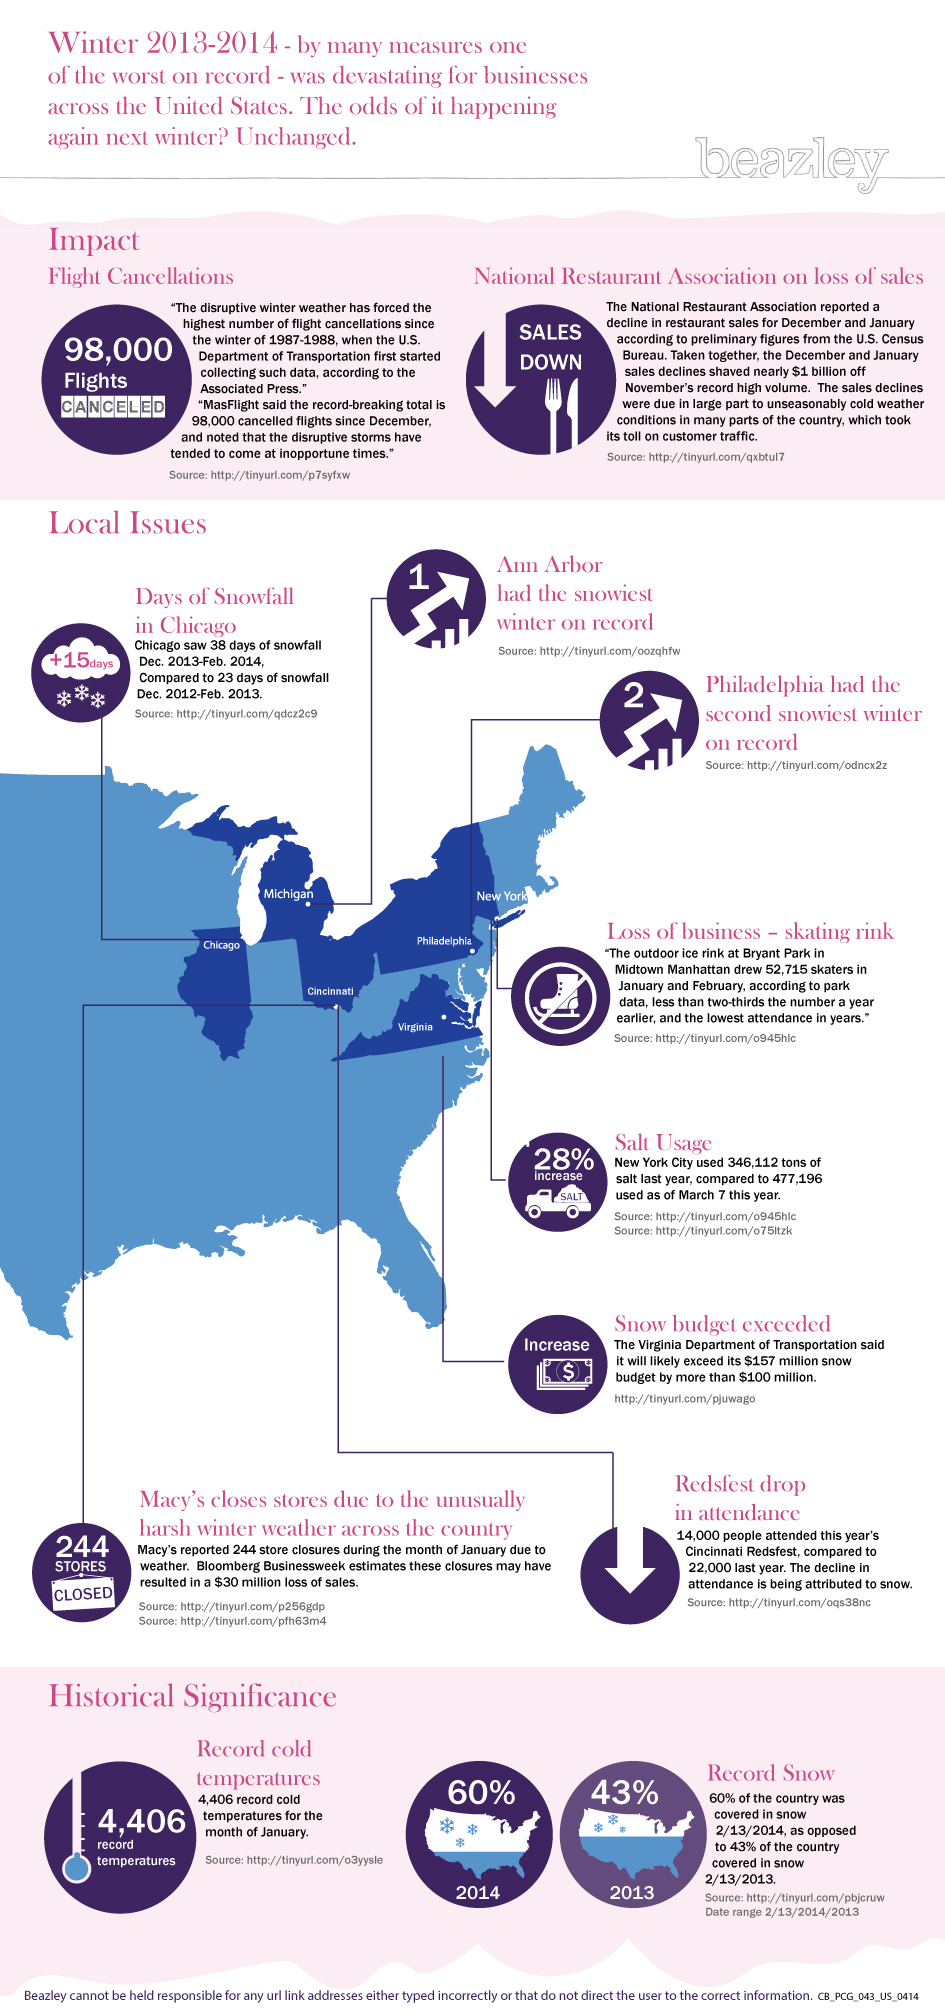
What a winter. As the “polar vortex” pushed cold weather from the arctic all the way to the deep south in the United States, severe snow storms and frigid temperature cost the American economy billions. While there have been obvious physical losses, such as roof collapses and endless potholes to repair, three less evident balance sheet exposures have wreaked havoc across a broad swath of industries. People are paying attention to the economic impact of the weather (witness #frozenomics on Twitter, a term coined by CNBC).  Here are some of the weather-related exposures we are watching:

  1. Event cancellations. This season’s major snowstorms and unrelenting freeze forced the cancellation of countless events, from conferences, to sporting events. Event hosts have suffered not only lost revenue from attendees, they forfeited the merchandise sales and “sunken costs” – from signage to non-refundable food and beverage deposits -of their suddenly defunct events. Even those that staged events far from the possibility of snowflakes felt the fallout, as airlines cancelled flights in record numbers. (Some 13,500 flights were cancelled in one week in February alone. ) In many cases, attendees just could not make the trip, as winter weather halted transport to even sunny locales.
  2. Lost income. When customers cannot be out and about due to winter weather, sales suffer, business income drops. One restaurant in Atlanta lost $75,000 in revenue due to the snow on Valentine’s Day alone. This season not only gave us enormous amounts of snow, but prolonged frigid temperatures and precarious ice-filled sidewalks kept customers away from everything from outdoor skating rinks, retail shops, to car dealerships. Event planners and business owners saw income decline accordingly.
  3. Snow removal. Extraordinary snow removal demands tore through the budgets of municipalities and highly-trafficked properties such as hotels and airports. Roadways, parking lots and sidewalks must be safe and passable, so entities had to reallocate to find funds for labor, salt, de-icer and grit. In many cases, these costs were two or three times the amounts anticipated for the season. Last month, the state of Virginia was projecting its snow removal costs could reach $370 million, or twice the usual expenses.  Even places that normally expect minimal, if any, snow suffered costly storms. Property managers and association board members up and down the East Coast have been left scratching their heads over what to predict for next year’s snow removal budget.

The sunshine of spring will make it easy to forget this winter’s wrath, but for many, the hard financial lessons of this winter will leave lasting impressions. Looking ahead to next winter, risk managers can use hindsight to be sure their business is well protected on all (weather) fronts. Versatile insurance solutions can do everything from addressing the multiple facets of event cancellation losses, to bringing certainty to snow removal budgets and stabilizing business income through stormy times.

The following infographic from Beazley offers some interesting statistics on the winter that was:

Mudslide Was Forewarned, Experts Assert

Shutterstock/Dan Schreiber. Mudslides scar Washington hillsides.

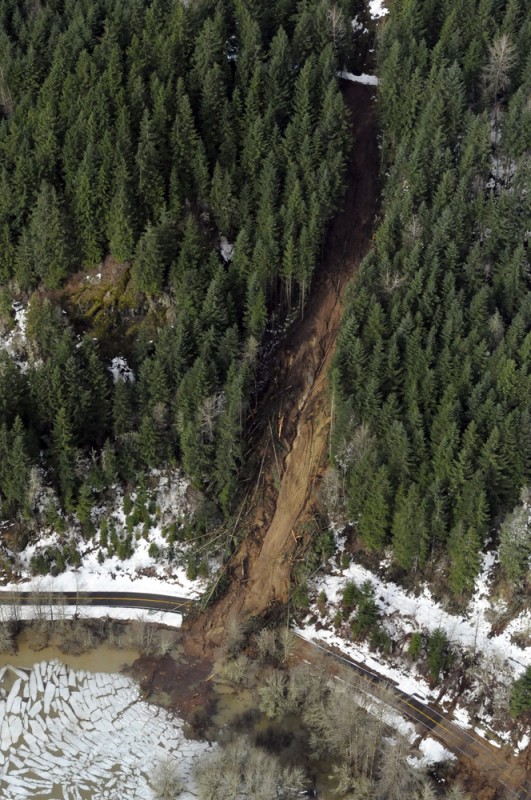
Even as rescue teams search for more bodies in the aftermath of the March 22 mud slide in Washington, records show that while the area is prone to these disasters, homes were allowed to be built there anyway.

The slide, triggered by excessive rain, has claimed 24 lives so far and 176 are still unaccounted for, the Associated Press reports.

Snohomish County Emergency Management Director John Pennington said during a news conference on March 24 that the slide was “completely unforeseen” and that it “came out of nowhere.”

In a 1999 report filed with the U.S. Army Corps of Engineers, however, geomorph­ologist Daniel J.

buy stendra online www.suncoastseminars.com/assets/top/stendra.html no prescription pharmacy

Miller and his wife, Lynne Rodgers Miller, warned of “the potential for a large catastrophic failure” in the area, according to the Seattle Times.

“We’ve known it would happen at some point,” Daniel Miller said. “We just didn’t know when.” He added that after a mudslide in 2006, he was surprised to find that more building was allowed in the area just weeks later. “Frankly, I was shocked that the county permitted any building across from the river,” he told the Seattle Times. “We’ve known that it’s been failing,” he said of the hill. “It’s not unknown that this hazard exists.

buy sildalis online www.suncoastseminars.com/assets/top/sildalis.html no prescription pharmacy

The area has a history of mudslides. After two earlier slides on the hill in 1949 and 1951, recommendations were made to permanently divert the Stillaguamish River or build berms to reinforce the slide area.

buy buspar online www.suncoastseminars.com/assets/top/buspar.html no prescription pharmacy

Howard Coombs of the University of Washington, however, concluded that any fix was likely to be temporary.

A thousand-foot berm was built in the fall of 1960, but it was mostly destroyed by high water in the Stillaguamish the following year, according to state records. Other barriers that were built were also destroyed by mud, the report said.

Tracy Drury, an environmental engineer and applied geomorphologist said there have been discussions over the years about whether to buy out property owners in the area, but that the talks never became serious proposals, The Seattle Times reported.

Marine Losses Continue Downward Trend

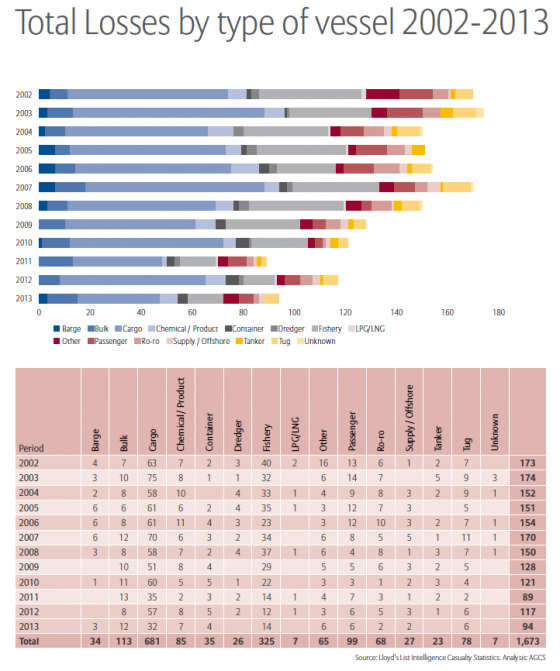
The marine industry continued to see a steady decline in the number of large ships losses globally since 2002, with 94 ships lost in 2013, down 20% from 117 reported in 2012, according to a study by Allianz.

The “Safety and Shipping Review 2014” by Allianz Global Corporate & Specialty found that of ships lost, the largest number, 32, were cargo vessels; 14 were fishing vessels; and 12 were bulk shipments. Only six passenger ships were lost, the survey found. The most common cause of losses in 2013, and over  the last 12 years, was foundering (sinking or submerging). The demise of 69 ships accounted for nearly three-quarters of all losses—with bad weather a significant driver.

Worldwide there were 1,673 losses from Jan. 1, 2002-Dec. 31, 2013, with an average of 139 per year. The top geographic area for losses has been South China, Indo China, Indonesia and Philippines. The area including British Isles, North Sea, English Channel and Bay of Biscay is still ranked fourth, despite improvement. With 45 losses overall, the U.S. eastern seaboard improved in 2013, dropping out of the top 10 regions.

According to the study, January is the worst month for all casualties in the Northern Hemisphere. There were 23% more losses in January compared with the quietest month, June. In the Southern Hemisphere July sees 41% more losses than April.

The majority of losses are caused by machinery damage, the reason for most losses in marine insurance. Statistics from the International Union of Marine Insurance (IUMI) report that 40% of hull claims are machinery damage and account for 20% of costs.

The review found that while piracy is still a threat, it has also subsided. Piracy at sea reached its lowest levels in six years, with 264 attacks recorded worldwide in 2013, a 40% drop since Somali piracy peaked in 2011. Fifteen incidents were reported off Somalia in 2013, including Gulf of Aden and Red Sea incidents, down from 75 in 2012, and 237 in 2011 (including attacks attributed to Somali pirates in Gulf of Aden, Red Sea and Oman).

According to the study: “The very real threat of piracy for ships operating in the Gulf of Aden reached the general public last year as the Hollywood Oscar-nominated blockbuster Captain Phillips was released. Tom Hanks played the lead as the master of the pirated Mærsk Alabama, broadcasting the piracy problem to a much wider audience and raising awareness of its consequences. The steps that the international maritime community has taken to reduce the threat of piracy in the Gulf of Aden have been extremely successful with the number of ships seized and hostages taken in 2013 significantly down on 2012.”

Lower losses overall were attributed to a number of factors including increased regulation, which has helped the maritime industry improve its safety record. Because the quality of operations varies in different regions, however, there is a big need for universal regulations on ship safety to reduce the risk of casualties and loss of life, the survey concluded.