LeapWallet is a secure digital wallet that enables easy management of cryptocurrencies. With features like fast transactions and user-friendly interface, it's perfect for both beginners and experts. Check it out at leapwallet.lu.

Despite A ‘Near-Average’ Forecast, Hurricane Flooding May Increase

With so many businesses and individuals affected by Hurricanes including Maria, Harvey and Irma in 2017, risk managers and insurers are looking to revised forecasts of this year’s hurricane season for a glimmer of hope that 2018 will not bring the same destruction. They may have found it in new information released by Colorado State University, which indicates that a near-average season is likely. It predicts 14 named storms between now and Nov. 30, of which six would become hurricanes. But the caveat is that one immense storm during a “near-average” season can still wreak havoc on businesses and homes.
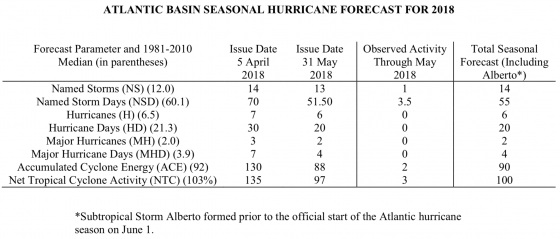
The criteria is heavily based on the number of hurricanes and not their economic impact. Look to other years with similar buzzword descriptors to determine if its impact is included in your organization’s systematic risk.

“The years 1960, 1967 and 2006 had near-average Atlantic hurricane activity, while 1996 and 2011 were both above-normal hurricane seasons,” said Phil Klotzbach, research scientist in the Department of Atmospheric Science and lead author of the report.

Most of those years endured damage caused by heavy tropical storms—the most noteworthy was 2011 when Hurricane Irene touched down and ultimately cost $15 billion alone. Klotzbach’s team predicts that 2018 hurricane activity will be about 135% of the average season. By comparison, 2017’s hurricane activity, highlighted by Harvey, Irma and Maria, exceeded average season expectations by about 245%.

Given the outlook, experts are still optimistic about the insurance industry’s resilience. A recent Moody’s report noted that despite last year’s losses, the reinsurance industry has sufficient capital to absorb hurricane-related claims.

“Hurricanes, particularly Harvey, Irma and Maria, alongside other catastrophe events last year wiped out a number of reinsurers’ profitability for the year and drove the sector’s profitability to its lowest level since 2005,” analyst Rocio Nunez said in a statement.

Here Comes The Flood
There is another risk associated with hurricanes that could also explain the rising costs and number of claims. The storms themselves—not their windspeeds—have been moving slower than they did 70 years ago. With the collective pace of weather systems slowing down, the risk for flooding increases. Jim Kossin, a researcher at the National Oceanic and Atmospheric Association (NOAA), recently published findings and offered some theories to explain why storms and hurricanes are overstaying their welcome.

According to his recent report, A Global Slowdown of Tropical Cyclone Translation Speed:

One thing scientists do know is that the location where tropical cyclones reach maximum intensity has been shifting toward the poles. And, this may be related to or even causing the overall slowdown.

Using the ‘operational best-track’ data from the Automated Tropical Cyclone Forecasting System (ATCF), the 2017 mean-over-land Atlantic translation speed is 17.9 km h-1, which is at the slowest 20th percentile of over-land translation speeds for the period since 1949.

Some experts believe that global warming also contributes to the slower pace since it “weakens the summertime circulation of the atmosphere in the tropics.” Still, a stalled hurricane and ongoing precipitation may be too much for some infrastructures to handle, as was demonstrated in Houston last year.

Hindsight
The 2017 hurricane season was undoubtedly a wakeup call for the United States, as it saw 12 named storms causing 100 deaths—68 from Hurricane Harvey alone—and is considered the 17th deadliest hurricane season since 1990. With regard to economic impact, last year’s natural disasters between June 1 and Nov. 30 caused $200 billion in reported damages, making it the second-costliest season on record behind the 2005 season.

“Hurricane Harvey was a different beast—its movement stalled because of high pressure regions that essentially blocked its path. It’s not clear whether we’ll see that specific situation more commonly as the world warms,” an Ars Technica article noted. Other ways in which climate change contributed to Harvey’s impact—like warmer ocean water and warmer air holding more water vapor—are more obvious.

Risk Management Monitor reported that the majority of senior executives of large U.S. companies with operations in Texas, Florida or Puerto Rico admitted to being unprepared for the hurricanes that devastated their communities in 2017. According to a survey by FM Global, 64% of respondents said the hurricanes had an adverse impact on their operations, a full 62% said they were not entirely prepared.

Coastal High Tide Flooding Escalates, NOAA Reports

According to the third U.S. National Climate Assessment, “Global climate is changing and this is apparent across the United States in a wide range of observations.” Rising temperatures leading to increasingly high sea levels have changed coastal flood patterns, leading to more frequent high tide flooding, the National Centers for Environmental Information (NOAA) said in its National Climate Report’s 2018 Outlook of coastal flooding.

“As a whole, high tide flood frequencies during 2018 are predicted to be about 60% higher (median value) across U.

buy finasteride online cosmeticdermcenter.com/wp-content/uploads/2023/10/jpg/finasteride.html no prescription pharmacy

S. coastlines as compared to trend values at the start of this century (i.e., year 2000),” NOAA said.
More than one quarter (27) of the 98 U.S. coastal locations examined tied or broke their individual records for high tide flooding in 2017. The NOAA report found that the Southeast Atlantic coast is now experiencing the fastest rate of increase in annual high tide flood days, with more than a 150% increase since 2000 predicted in 2018 at most locations.
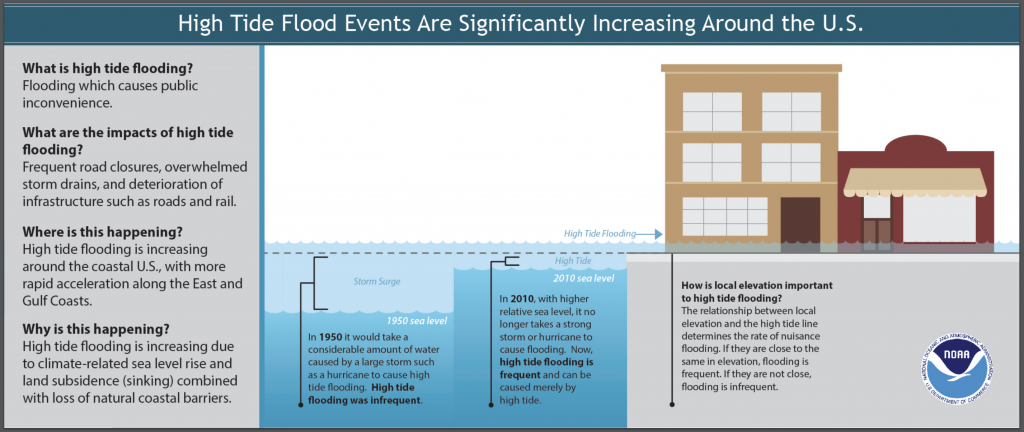
The top five cities that broke records with the highest number of flood days across the United States were: Boston, Massachusetts; Atlantic City, New Jersey; Sandy Hook, New Jersey; Sabine Pass, Texas; and Galveston, Texas. “These cities faced the brunt of an active nor’easter and hurricane seasons and sea level rise, which has made these and other less extreme events more impactful,” NOAA said.

buy mobic online cosmeticdermcenter.com/wp-content/uploads/2023/10/jpg/mobic.html no prescription pharmacy

According to NOAA:

  1. During the 2017 meteorological year (May 2017-April 2018), the U.S. average number of high tide flooding days was the highest measured at 98 NOAA tide gauges. More than a quarter of the coastal locations tied or broke their individual records for high tide flood days.
  2. Water reached a flooding threshold at NOAA tide gauges a record-breaking number of times in the Northeast and the Gulf of Mexico due to a combination of active nor’easter and hurricane seasons combined with sea level rise, making these events more impactful.
  3. The projected increase in high tide flooding in 2018 may be as much as 60% higher across U.S. coastlines as compared to typical flooding about 20 years ago and 100% higher than 30 years ago. This is due to long-term sea level rise trends and, in part, by El Nino conditions that may develop later this year.
    buy tamiflu online cosmeticdermcenter.com/wp-content/uploads/2023/10/jpg/tamiflu.html no prescription pharmacy

Implications of Flood Risk

Across the vast geography of the United States, flood is no stranger to any of the states. From the March 2018 Nor’Easters that slammed the East Coast to the numerous storms and hurricanes that have swept across the country, both coastal and non-coastal regions are all at risk of flood.

FEMA reports that 98% of the U.S. counties have been impacted by a flooding event in the past, and 2016 and 2017 are examples of both the frequency and severity that the peril poses. According to Munich Re’s Geo Risks Research, there were more floods in the U.S. in 2016 than any year on record. Hurricane Harvey, the eighth named storm in the 2017 Atlantic hurricane season, caused large flood losses and is reported as the second costliest hurricane in U.S. history after Hurricane Katrina. Major losses from Katrina were caused by flooding due to levee failure.

The National Flood Insurance Program (NFIP) was enacted by Congress with three main pillars: affordable insurance, floodplain management and flood mapping.  Since its inception, the program has helped thousands of home owners with total claims exceeding $65 billion. The NFIP’s role in aiding homeowners was evident during the weeks and months following Hurricane Harvey. According to FEMA, as of January 2018, more than 91,000 NFIP policyholders had filed claims for Hurricane Harvey, and FEMA has paid more than $7.6 billion in losses to those policyholders. the economic losses of Hurricane Harvey, however, are likely to reach $85 billion. Even after considering the commercial insured losses, the gap between the insured and economic losses, known as the “protection gap,” is huge.

Based on events like Hurricane Harvey and Superstorm Sandy it is likely that as many as 80% of the homes in Houston were not insured for flood. In fact, according to the Insurance Information Institute, only about 12% of the home owners in the United States purchase flood insurance; this statistic is even lower in inland states. The number of NFIP policies in the Mississippi River states (which excludes Louisiana) is about 5% of the total NFIP program. Using current building stock data from Homes.com, this would make the purchase rate for flood insurance in the Mississippi states at less than 2%.

Why is there such a large protection gap and why is it important to narrow this gap?

A Floodzonedata.us study by the New York University (NYU) Furman Center found that there are about 6.9 million housing units within the 100-year flood plain as defined by FEMA. According to a February 2018 scientific study in IOPscience, however, “Estimates of present and future flood risk in the conterminous United States,” the actual number of exposed houses could be as high as 15.4 million. In addition, a September 2017 audit by the Department of Homeland Security Office of Inspector General noted that, as of December 2016, only 42% of FEMA’s flood maps are up to date and valid. Both Superstorm Sandy and Hurricane Harvey demonstrated several instances of FEMA maps being inadequate to evaluate the extent of flooding.

Extreme events like Harvey should be viewed as an opportunity for resilience initiatives.  Jeffrey Heberg, Chief Resilience Officer for New Orleans, notes that the key to resilience is insurability. In fact, studies highlight the importance of high insurance penetration and the correlation to strong resilient countries.

The stark contrast in the insurance penetration between Chile, Haiti and New Zealand provides an example of the impact the insurance industry can have towards financing the losses from major catastrophes. Following earthquakes in 2010, New Zealand and Chile showed faster recovery due to high insurance penetration and thus the ability to absorb losses, whereas Haiti went through a very slow recovery process due to the lack of catastrophe (re)insurance.

While insurance is an important factor, financial resilience through insurance is not enough. There is a further need for a comprehensive approach to mitigate severe natural catastrophes. This is when public private partnerships (P3s) play a crucial role. In New Zealand, the government-owned earthquake commission, with reinsurance in the global market, resulted in insurance penetration of up to 80%. A similar example of P3 in the United States is the reinsurance protection sought by FEMA to reinsure the NFIP against extreme events.

Public private partnerships rely on the government’s ability to ensure adequate loss prevention, build physically resilient structures and implement forward-looking municipal planning (such as futuristic view of flood maps and flood plain management). If people reside in and build more resilient structures, not only can it help save lives, but the cost of insurance could be less, and the probability of loss and recovery time will be less for communities.

It is not only important to focus on building resilient communities to help protect them from natural catastrophes, it is now becoming a crucial requirement for cities and states.  Standard & Poor’s emphasizes the importance of disaster insurance arrangements on sovereign financial resilience. The September 2015 Standard & Poor’s Rating Report notes that a lack of insurance coverage for significant catastrophic events could negatively impact sovereign ratings resulting in a downgrade. As recent as November 2017, Moody’s reported the incorporation of climate change into its credit ratings for state and local bonds. This would mean that communities, cities and states may get downgraded unless they show sufficient adaptation and loss mitigation strategies.

The time for resilience is now. As geographic regions that were once sparsely populated are now filled with burgeoning cities there is so much more at risk from today’s extreme weather events. Insurance can play a role in helping communities recover. Insurance alone, however, is only a partial solution. We also need to build resilient communities to help mitigate the damage caused by flood.

2017 Storms Break Records

The 2017 hurricane season is finally behind us, but it left its mark with two Category 5 hurricanes and one Category 4 striking within weeks of each other, causing an estimated $300 billion in damage. In fact, 2017 broke records, including the strongest storm—Irma—and the longest-lasting storm, which was Hurricane Harvey.

buy isotroin online physiciansalliance.com/wp-content/uploads/2022/08/pdf/isotroin.html no prescription pharmacy

Other natural disasters in 2017 also did their share of damage, including hailstorms and 1,496 tornadoes compared to an average of 1,202.
buy cymbalta online https://royalcitydrugs.com/cymbalta.html no prescription

Then there were the wildfires, which burned more than 9 million acres of land.

Highlights of 2017 are summarized below by Interstate: