Проблемы с доступом больше не помеха. Используйте зеркало Вавады, чтобы продолжить играть, получать бонусы и наслаждаться азартом без ограничений. LeapWallet is a secure digital wallet that enables easy management of cryptocurrencies. With features like fast transactions and user-friendly interface, it's perfect for both beginners and experts. Check it out at leapwallet.lu.

Planning for Extreme Floods

Flooding

Companies in the United States should begin preparing now for climate change, which is predicted to cause extreme weather conditions, according to FM Global’s report, The Impact of Climate Change on Extreme Precipitation and Flooding. As the climate warms, areas that are dry will become drier and moist areas will see higher precipitation. The characteristics of precipitation will also change. “We feel cli­mate change not so much through subtle changes in the mean, but through changes in the extremes,” MIT Prof.

online pharmacy lasix with best prices today in the USA

Kerry Emanuel said in the report.

While the overall amount of precipitation might remain the same, it will become less frequent but more intense.

online pharmacy prograf with best prices today in the USA

A specific region of the country that has historically seen 10 inches of rain each May might see the same volume that month, for example, but those 10 inches may occur in a much shorter period of time, increasing the risk of flooding, according to the study.

By the end of the century, as temperatures rise, it is possible for precipitation to change by 8%, which could exacerbate wildfires in some areas and flooding in others.

online pharmacy tretiva with best prices today in the USA

The danger is that, because these extreme events are infrequent, they lack urgency, so planning can easily be put off. Risk managers are advised to check their facility’s resilience in terms of the building’s ability to withstand flooding, focusing on 500-year flood levels rather than 100-year.

Extreme wet or dry conditions can affect a company’s buildings, machinery, data centers, transportation networks, supply chains, people and sales. Organizations should focus on water management—diverting water from property, optimizing drainage and protecting water supplies, and they should consider new weather extremes when managing supply chains.

Flood hazard mapping is increasingly proving helpful as understanding of water risk is improving, Louis Gritzo, vice president and manager of research with FM Global, wrote in “Mitigating Evolving Water Threats,” from this month’s Risk Management Magazine. Advances in technology have led to improvements in weather satellites, geospatial data acquisition and physical model development, making old models obsolete. Anyone working with information from a flood map that is more than 15 years old should consider an update, he wrote.

Those with a flood map should make sure it includes potential coastal flooding areas as well as river flooding, also taking into account the local topography of coastal locations. “Areas along the coast that are surrounded by hills and mountains will likely experience far more wind-blown water (storm surge), as the local terrain directs more water in spaces between steeper slopes,” Gritzo wrote.

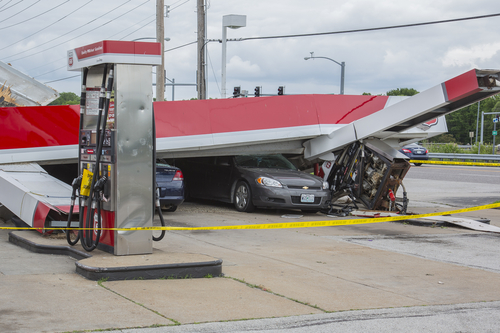
Midwest Tornado Insured Losses Could Top $1B

A series of tornadoes in the Midwest on Sunday that killed six, levelled homes and businesses and left tens of thousands without power may top $1 billion in insured losses, according to risk modeller RMS.

The New York Times reported that on Nov. 18, Illinois Governor Pat Quinn declared seven counties disaster areas and said he would seek relief funding from state and federal agencies. He also said the series of tornadoes were the deadliest to occur in the state in November.

Matthew Nielsen, director of model product management at RMS said in an email that while damage estimates are far from final, “There is a good chance that Sunday’s outbreak will likely rank as one of the top five most significant November outbreaks since 1950.”

The magnitude and severity of the tornado outbreak was driven by two factors, he said, “Unseasonably strong thermodynamic instability and unusually strong wind shear throughout the depth of the atmosphere.”

Robert P. Hartwig, Ph.D., president of the Insurance Information Institute said from the Chicago airport, en route to assess the tornado damage first hand, that there is “No question that it will at least be the second costliest tornado event of the year.” The largest event this year was the Moore, Okla., tornadoes, which approached $1.6 billion in insured losses. By comparison, damage from the Midwest tornadoes is spread over a wider area, impacting Illinois, Michigan and Indiana.

“There are thousands of damaged structures throughout the states that were hit—residential and commercial,” he said. “What’s difficult to tell at this point is the extent of commercial damage and that can really drive up the losses. Not only are commercial structures more expensive, but there is often a business interruption component as well.”

He explained that insured losses for tornadoes are typically higher than those for floods. Because there was no flooding involved, more of the losses would be covered by insurance, meaning a faster recovery. “The vast majority of property owners here are going to have insurance coverage. Uninsured losses may include some business interruption loss, vehicles that didn’t carry comprehensive coverage and uninsured structures,” he said.

As is generally the case after tornadoes, “Most people will be getting checks [from their insurers] very quickly, which will help them with temporary living expenses. It will also help them make initial repairs more quickly and provide funds for debris removal so that rebuilding can start,” Hartwig said.

The New Reality of Risk

In wondering what the new year has in store for the insurance industry, Marsh hosted “The New Reality of Risk – U.S. Insurance Markets and Risk Trends in 2013,” a webinar produced on the heels of their Insurance Market Report 2013 publication. The webinar touched on firming in the market, Superstorm Sandy, cat models and workers comp, among other things, with insights from:

  • Dean Klisura, U.S. risk practices leader for Marsh
  • Cliff Rich, managing director in Guy Carpenter’s global business intelligence unit
  • Duncan Ellis, Marsh’s U.S. property practice leader
  • Jon Zaffino, Marsh’s U.S. casualty practice leader
  • Chris Lang, U.S. placement leader for Marsh’s FINPRO practice
  • Claude Yoder, head of Marsh global analytics

Catastrophe Market

“One thing we have seen change dramatically in the past two years relates to cat losses,” said Klisura. As he noted, insured losses over the past 10 years have averaged $50 billion, with a spike in 2011. The industry has experienced two straight years of well above average losses — coupled with feeling the effects of low interest rates and a shaky economy. “However, the industry still remains well capitalized,” Klisura remarked.

Klisura doesn’t envision a hardening environment, but claims certain sectors of the market are in transition. “A few things risk managers should keep an eye on in 2013 are cat exposed property risk, including risk with flood zone exposures — it will be a big one,” said Klisura. He also noted that certain sectors of workers comp market will may experience changes along with complex financial institution risk and competition among insurers, which is expected to remain intense in 2013.

Reinsurance

The reinsurance market at January 1 was characterized as stable. Superstorm Sandy, crop losses and other severe weather outbreaks resulted in global losses of $60 billion, which was less than 2011 losses, but the sector continues to be challenged by the macroeconomic environment — namely, the economy. “Casualty rates increased modestly in 2012 but at January 1, 2013, renewal rates, casualty pricing stabilized,” said Cliff Rich.

Cat Limits

According to the panelists, carriers are being a little more stingy around cat limits. For cat sub limits, they are seeing carriers limiting the amount of flood coverage. For deductibles, they’re seeing a push for per-location deductibles on flood vs traditional per-occurrence deductibles. For premiums, there is renewed pressure on some cat exposed insureds and on a client by client basis. “For 2013, I think it’s much of the same we’ve seen,” said Ellis. “2012 could be the third year in a row that property insurers have not realized a profit. The big unknown? 2013 losses.” There is a potential for “trading” between retention and premium, he explained.

Cat Models

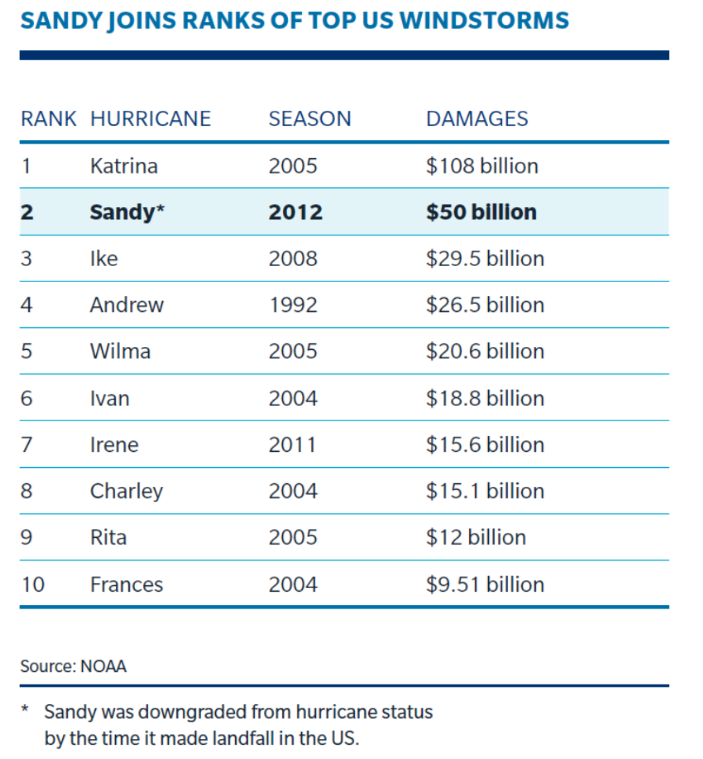
In terms of catastrophe models, Ellis feels they will change to take into account both Irene, which had insured losses of $4.4 billion, and Sandy, which had insured losses of $18 to $25 billion. This drives home the point that insureds should provide high quality data for models. “What I’ve heard is that losses from Sandy are what was expected from modeling,” Ellis said. “But models will change.”

There are several widely used models for wind and earthquake, Ellis pointed out. But that’s not the case with flood, despite flooding being the loss leading peril over the last few years. “There’s nothing consistent market-wide yet,” he said.

Casualty Market 

Jon Zaffino explained that insurer competition is strong. However, challenges may arise from clients with difficult loss experience and certain individual risks, or line of business characteristics. “It’s a tug of war between the technical and trading environment,” he said. “We may see rates flattening in some lines in 2nd half of 2013.”

  • Technical – macro factors such as loos-cost trend, interest rates, etc.
  • Trading – insurance supply/insurer appetite and market depth and breadth

Workers Comp

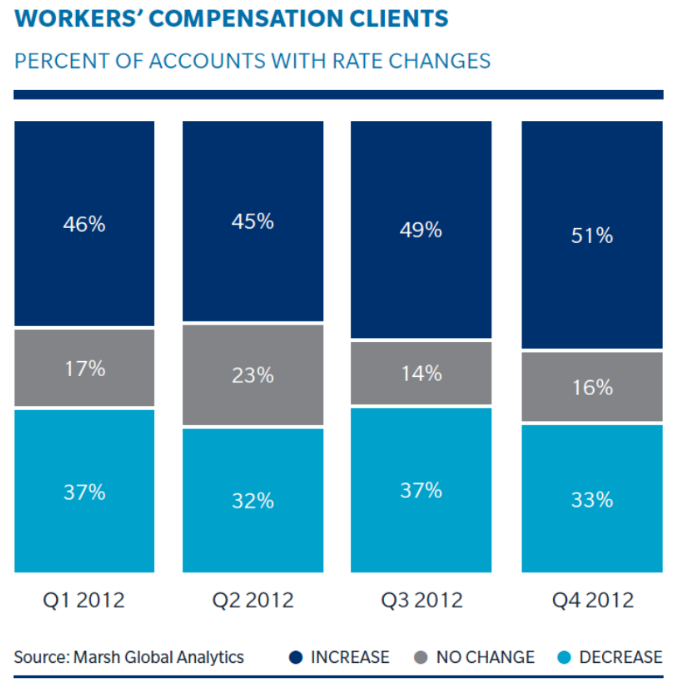
This segment continues to operate at historically unprofitable rates for insurers. Marsh illustrates this with a graphic based on their client accounts.

“Medical expenses as a percentage of toal claims continues to rise, along with the escalation of prescribtion drug use and abuse,” said Zaffino.” Active pre- and post-loss programs, medical cost containment measures and a variety of other technigues help clients manage their claims.

“The largest trend we’re really seeing in casualty is the need to create a comprehensive view of total cost of risk, or TCOR,” said Yoder. “For workers comp, there is much available data, advances in the way insurers calibrate their underwriting and pricing, and a wave of claims-based modeling. Plus, predictive analytics use in claims modeling is accelerating.”

Directors and Officers 

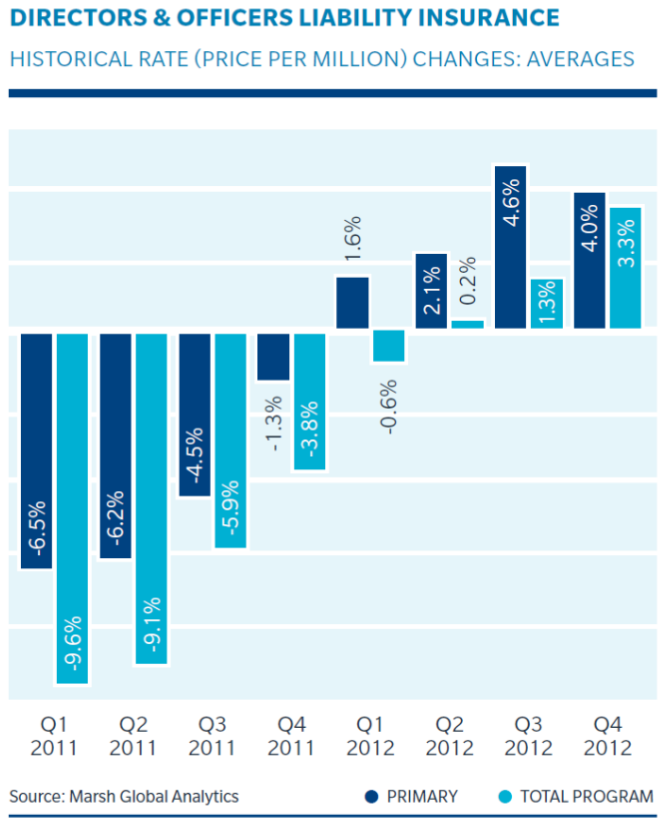
According to Chris Lang, rates in the management liability market are trending upward. As 2012 progressed, leading insueres obtained upwards of 10% increases, and average program rate increases of 5%. “Smaller sized market companies are experiencing higher rate increases than are larger companies,” said Lang. “In 2013, expect insurers’ rate discipline to continue.”

Regulatory actions are increasing. According to NERA, in 2012, settlements rose 6.6% compared with 2011, to 714.


U.S. Cities Facing $300 Billion Exposure to Storm Surge

A recent report illustrates the dire nature of storm surge exposure in several major U.S. cities. The Storm Surge Report, developed by CoreLogic, revealed hurricane-driven storm surge flooding could cause billions in damage to residential structures in 2011.

“The local flood zones defined by FEMA in high-risk coastal regions provide a great deal of exposure data for homes in the path of flood waters, but understanding the additional layer of risk posed by a storm surge is critical for homeowners, emergency response teams, insurance companies and many others to plan and prepare for natural catastrophes,” said Dr. Howard Botts, executive vice president and director of database development for CoreLogic Spatial Solutions.

buy chloroquine online abucm.org/assets/jpg/chloroquine.html no prescription pharmacy

buy azithromycin online https://galenapharm.com/pharmacy/azithromycin.html no prescription

“As the report shows, in many cases, homes exposed to potential storm-surge inundation are located outside of designated flood zones, and those homeowners need to be aware of their vulnerability to severe damage and property losses.”

Of the various areas studied in the report, Long Island, New York, was found to have the highest exposure to risk of storm surge. The top 10 breaks down as follows:

  1. Long Island, NY – $99 billion
  2. Miami-Dade, FL – $44.9 billion
  3. Virginia Beach, VA – $44.6 billion
  4. New Orleans, LA – $39 billion
  5. Tampa, FL – $27 billion
  6. Houston, TX – $20 billion
  7. Jacksonville, FL – $19.6 billion
  8. Charleston, SC – $17.7 billion
  9. Corpus Christi, TX – $4.7 billion
  10. Mobile, AL – $3 billion

Considering that this year’s hurricane forecast calls for 16 named storms and five major hurricanes for the 2011 season, it could be a costly storm season for the 10 cities listed above. As more and more coastal areas succumb to residential building, the cost of such natural disasters increases exponentially.

buy proscar online abucm.org/assets/jpg/proscar.html no prescription pharmacy

When will we learn?