Want to scan your crypto wallet for risks? Check: AML crypto BTC, USDT, ETH. Checking cryptocurrency wallets for dirty money.

Uptick Charted in Telemedicine Cyberrisk

Advances in telemedicine have benefited patients, but, as with any emerging technology, they also create exposure to cybersecurity risk.

buy xenical online thecifhw.com/wp-content/uploads/2023/10/jpg/xenical.html no prescription pharmacy

In addition to patients’ data, monitoring and diagnostic devices that can provide treatment from a distance can be compromised due to a variety of causes—from hackers to employee error.

Because of a drastic increase in internal threats, cyber events have become a prevalent threat—with alarming consequences for employers and patients. While malicious actors are perceived as a major threat, 43% of healthcare cyber events are the result of internal threats, according to The Identity Theft Resource Center’s 2017 Annual Data Breach Year-End Review.

The study found that hacking continues to rank highest in the type of attack, at 59.

buy tenormin online thecifhw.com/wp-content/uploads/2023/10/jpg/tenormin.html no prescription pharmacy

4 % of breaches—an increase of 3.2% over 2016 figures. Overall, the Review indicates a drastic upturn, with a 44.7% increase over the record high figures reported for 2016.

buy seroquel online thecifhw.com/wp-content/uploads/2023/10/jpg/seroquel.html no prescription pharmacy

Here’s more information on cyber breaches and other potentially damaging threats:

Implications of Flood Risk

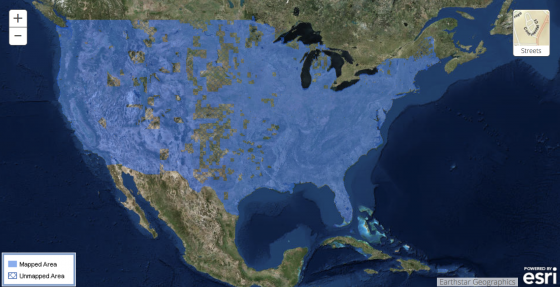
Across the vast geography of the United States, flood is no stranger to any of the states. From the March 2018 Nor’Easters that slammed the East Coast to the numerous storms and hurricanes that have swept across the country, both coastal and non-coastal regions are all at risk of flood.

FEMA reports that 98% of the U.S. counties have been impacted by a flooding event in the past, and 2016 and 2017 are examples of both the frequency and severity that the peril poses. According to Munich Re’s Geo Risks Research, there were more floods in the U.S. in 2016 than any year on record. Hurricane Harvey, the eighth named storm in the 2017 Atlantic hurricane season, caused large flood losses and is reported as the second costliest hurricane in U.S. history after Hurricane Katrina. Major losses from Katrina were caused by flooding due to levee failure.

The National Flood Insurance Program (NFIP) was enacted by Congress with three main pillars: affordable insurance, floodplain management and flood mapping.  Since its inception, the program has helped thousands of home owners with total claims exceeding $65 billion. The NFIP’s role in aiding homeowners was evident during the weeks and months following Hurricane Harvey. According to FEMA, as of January 2018, more than 91,000 NFIP policyholders had filed claims for Hurricane Harvey, and FEMA has paid more than $7.6 billion in losses to those policyholders. the economic losses of Hurricane Harvey, however, are likely to reach $85 billion. Even after considering the commercial insured losses, the gap between the insured and economic losses, known as the “protection gap,” is huge.

Based on events like Hurricane Harvey and Superstorm Sandy it is likely that as many as 80% of the homes in Houston were not insured for flood. In fact, according to the Insurance Information Institute, only about 12% of the home owners in the United States purchase flood insurance; this statistic is even lower in inland states. The number of NFIP policies in the Mississippi River states (which excludes Louisiana) is about 5% of the total NFIP program. Using current building stock data from Homes.com, this would make the purchase rate for flood insurance in the Mississippi states at less than 2%.

Why is there such a large protection gap and why is it important to narrow this gap?

A Floodzonedata.us study by the New York University (NYU) Furman Center found that there are about 6.9 million housing units within the 100-year flood plain as defined by FEMA. According to a February 2018 scientific study in IOPscience, however, “Estimates of present and future flood risk in the conterminous United States,” the actual number of exposed houses could be as high as 15.4 million. In addition, a September 2017 audit by the Department of Homeland Security Office of Inspector General noted that, as of December 2016, only 42% of FEMA’s flood maps are up to date and valid. Both Superstorm Sandy and Hurricane Harvey demonstrated several instances of FEMA maps being inadequate to evaluate the extent of flooding.

Extreme events like Harvey should be viewed as an opportunity for resilience initiatives.  Jeffrey Heberg, Chief Resilience Officer for New Orleans, notes that the key to resilience is insurability. In fact, studies highlight the importance of high insurance penetration and the correlation to strong resilient countries.

The stark contrast in the insurance penetration between Chile, Haiti and New Zealand provides an example of the impact the insurance industry can have towards financing the losses from major catastrophes. Following earthquakes in 2010, New Zealand and Chile showed faster recovery due to high insurance penetration and thus the ability to absorb losses, whereas Haiti went through a very slow recovery process due to the lack of catastrophe (re)insurance.

While insurance is an important factor, financial resilience through insurance is not enough. There is a further need for a comprehensive approach to mitigate severe natural catastrophes. This is when public private partnerships (P3s) play a crucial role. In New Zealand, the government-owned earthquake commission, with reinsurance in the global market, resulted in insurance penetration of up to 80%. A similar example of P3 in the United States is the reinsurance protection sought by FEMA to reinsure the NFIP against extreme events.

Public private partnerships rely on the government’s ability to ensure adequate loss prevention, build physically resilient structures and implement forward-looking municipal planning (such as futuristic view of flood maps and flood plain management). If people reside in and build more resilient structures, not only can it help save lives, but the cost of insurance could be less, and the probability of loss and recovery time will be less for communities.

It is not only important to focus on building resilient communities to help protect them from natural catastrophes, it is now becoming a crucial requirement for cities and states.  Standard & Poor’s emphasizes the importance of disaster insurance arrangements on sovereign financial resilience. The September 2015 Standard & Poor’s Rating Report notes that a lack of insurance coverage for significant catastrophic events could negatively impact sovereign ratings resulting in a downgrade. As recent as November 2017, Moody’s reported the incorporation of climate change into its credit ratings for state and local bonds. This would mean that communities, cities and states may get downgraded unless they show sufficient adaptation and loss mitigation strategies.

The time for resilience is now. As geographic regions that were once sparsely populated are now filled with burgeoning cities there is so much more at risk from today’s extreme weather events. Insurance can play a role in helping communities recover. Insurance alone, however, is only a partial solution. We also need to build resilient communities to help mitigate the damage caused by flood.

Workforce Drug Positivity Rate Still Peaking

Workforce use of illicit drugs across the board—including cocaine, marijuana and methamphetamine—remains at its highest rate in a decade, a new study by Quest Diagnostics found.

Overall positivity in urine drug testing among the combined U.S. workforce in 2017 continued to hold at 4.2%, which is still 0.7% higher than the positivity rate from 2012, which represented a 30-year low. The findings were made from analysis of more than 10 million workforce drug test results.

“It’s unfortunate that we mark 30 years of the Drug-Free Workplace Act with clear evidence that drugs continue to invade the country’s workplaces. Not only have declines appeared to have bottomed out, but also in some drug classes and areas of the country drug positivity rates are increasing,” Barry Sample, senior director of science and technology at Quest Diagnostics, said in a statement.

buy chloroquine online orthosummit.com/wp-content/uploads/2023/10/jpg/chloroquine.html no prescription pharmacy

“These changing patterns and geographical variations may challenge the ability of employers to anticipate the ‘drug of choice’ for their workforce or where to best focus their drug prevention efforts to ensure a safe and healthy work environment.”

The new data indicates shifting patterns of drug use, with cocaine and amphetamines positivity surging in some areas of the country and marijuana positivity rising sharply in states with newer recreational use statutes.

Opioids
The one bit of good news is that prescription opiate positivity rates declined dramatically on a national basis. Quest reported that the positivity rate for opiates in the general U.S. workforce in urine drug testing declined 17% between 2016 and 2017 (0.47% versus 0.39%). More notably, oxycodones (oxycodone and/or oxymorphone) positivity declined 12% between 2016 and 2017 (0.69% vs. 0.61%), hydrocodone positivity declined 17% (0.81% vs. 0.67%); and hydromorphone positivity declined 22% (0.59% vs. 0.46%). Opiates other than codeine were at their lowest positivity rate in more than a decade.

This data is supported by the Centers for Disease Control and Prevention (CDC), which shows that the overall national opioid prescribing rate in 2017 fell to the lowest it had been in more than 10 years, although rates vary by state and are high in some areas of the country.

The topic was explored during an educational session at RIMS 2018, where it was noted that the decrease in opioid use may be attributed to corporate initiatives like prescription drug monitoring policies (PDMP), which can limit employees’ ability to refill scripts, in addition to states that had comprehensive reforms.

“This shows that the more queries there are, the bigger the drop in opioid prescribing,” said John Ruser, president and CEO of the Workers Compensation Research Institute (WCRI), last month in San Antonio. He said WCRI used Kentucky as an example of a successful PDMP. Kentucky’s HB1 law mandated the use of the PDMP and between 2011 and 2013, WCRI information indicated a 10% decline in prescriptions in the state, whereas prescription levels were flat in others that did not have similar reforms.

Methamphetamine
Methamphetamine positivity, however, is increasing. An analysis of trends in the general U.S. workforce based on the four U.S. Census regions identified large increases of methamphetamine positivity rates. Between 2013 and 2017, methamphetamine positivity increased: 167% in the East North Central division of the Midwest (Illinois, Indiana, Michigan, Ohio, Wisconsin); 160% in the East South Central division of the South (Alabama, Kentucky, Mississippi, Tennessee); 150% in the Middle Atlantic division of the Northeast (New Jersey, New York, Pennsylvania); and 140% in the South Atlantic division of the South (Delaware, District of Columbia, Florida, Georgia, Maryland, North Carolina, South Carolina, Virginia, West Virginia). The percentage increase in these four divisions ranged between 9% and 25% between 2016 and 2017.

Marijuana
Overall, marijuana positivity continued its five-year upward climb for both the general U.S. workforce and the federally-mandated, safety-sensitive workforce. Marijuana positivity increased 4% in the general U.S. workforce (2.5% in 2016 versus 2.6% in 2017) and nearly 8% in the safety-sensitive workforce (0.78% versus 0.84%).

Increases in positivity rates for marijuana were most striking in states that have enacted recreational use statues since 2016. Those states include: Nevada (43%), Massachusetts (14%) and California (11%). These three states also saw significant increases in marijuana positivity in federally-mandated, safety-sensitive workers: Nevada (39%), California (20%), and Massachusetts (11%). Federally-mandated, safety-sensitive workers include pilots, rail, bus and truck drivers, and workers in nuclear power plants, for whom routine drug testing is required by the Department of Transportation.

buy augmentin online orthosummit.com/wp-content/uploads/2023/10/jpg/augmentin.html no prescription pharmacy

“These increases are similar to the increases we observed after recreational marijuana use statues were passed in Washington and Colorado,” Sample said. “While it is too early to tell if this is a trend, our data suggest that the recreational use of marijuana is spilling into the workforce, including among individuals most responsible for keeping our communities safe.”

Hawaii Volcanic Activity Reinforces States’ Need for Catastrophe Planning

Recent volcanic activity in Hawaii has turned national attention to emergency preparedness planning. As previously reported, the Kilauea eruption lessened but caused aftershocks, lava flow and lingering hazardous fumes in nearby areas. About 1,800 people live in the area, which was ordered to be evacuated last week by Hawaii County. No deaths or injuries have been reported.

On May 9, two more actively erupting fissures from the Kilauea volcano opened near Lanipuna, a neighboring community to the already affected Leilani Estates. Fox News reported that first responders went door to door to ensure everyone in the community was safely evacuated. At least 14 fissures are now open from Kilauea—considered one of the world’s most active volcanoes—with some releasing toxic gases and others spewing lava, at times at least 200 feet into the air.

Hawaii Gov. David Ige signed a Presidential Disaster Declaration request, asking President Donald J. Trump to declare the state a major disaster as a result of the ongoing seismic activity. Gov. Ige also requested assistance from the Federal Emergency Management Agency (FEMA), citing the unpredictable nature of the volcano, the number of structures destroyed, and the fact that residents may be unable to return to their homes for an undetermined amount of time.

Gov. Ige said in his Presidential Declaration request:

As more fissures open and toxic gas exposure increases, the potential of a larger scale evacuation increases. A mass evacuation of the lower Puna District would be beyond current county and state capabilities, and would quickly overwhelm our collective resources. Federal assistance would be necessary to enable us to successfully conduct such large-scale operations.

CBS reported that many people in the affected communities live in “lava zone one,” a high-risk area. Lava insurance doesn’t exist and homeowners’ insurance is very expensive, so some are going to be left on their own to try and rebuild.

With all these events, however, visitors to Hawaii.gov will find very little, if anything about the volcanic eruption on the state’s homepage [see screenshot]. Instead, there is much about the mild weather and announcements of a groundbreaking ceremony for a road pavement rehabilitation and the modernization of its payroll system. All-in-all, it’s difficult for the public to gage imminent dangers, such as the dangers of molten lava on the site. Visitors, as well as residents, need to navigate to the Residents Page to find the Emergency Information.

What Other States Can Learn
While volcanic eruptions may be relatively infrequent in the continental United States, the threat exists: There are 169 active volcanoes in the U.S., and 54 of them are considered high threats by the United States Geological Survey (USGS). Washington is one state that is proactive in its planning, and May just happens to be when it observes Volcano Preparedness Month. Washington has had five active volcanoes: Mount Rainier, Mount Baker, Mount Adams, Glacier Peak, and Mount St. Helens. The latter volcano erupted in 1980 and demonstrated the disaster potential of volcanoes, causing an estimated $31 million in insured losses. That eruption killed 57 people and left dramatic changes to the landscape. It undoubtedly impacted state officials, who regularly include environmental and natural disasters in their strategic plans.

King County, Washington is in close proximity to these volcanoes and has a page dedicated to volcanic activity. It explains how its active volcanoes pose different threats from Hawaii’s:

Unlike Hawaiian volcanoes that ooze molten lava, volcanoes in the Pacific Northwest are known for sending choking ash, hot rocks, and poisonous gases high into the sky. Lahars, which are deadly mixes of hot mud, ash, and other debris, are also a big concern.

It also advises how residents and businesses should prepare and react in the event of an eruption. After ashfall:

  • Wear goggles to protect your eyes and long-sleeved shirt and pants to protect your skin.
  • Clear roofs and rain gutters of ashfall. Ashfall is very heavy and can cause buildings to collapse. Use extreme caution when working on a roof.
  • Avoid running vehicle engines. Driving can stir up volcanic ash that can clog engines, damage moving parts, and stall vehicles.
  • Avoid driving in heavy ashfall unless absolutely required. If you must drive, keep the speed down to 35 MPH or slower. Be prepared to change oil, oil filter, and air filters frequently (every 50 to 100 miles in heavy dust and every 500 to 1,000 miles in light dust).
  • As much as possible, keep ash out of buildings, machinery, air and water supplies, downspouts, storm drains, etc.

In 2017, King County co-hosted a climate change resiliency summit with the United Kingdom’s consulate to assess the physical geography and explore better emergency preparedness plans.

Risk Manager of the Year Honor Roll Member Jennifer Hills already had natural disasters on her radar. The director of risk management for King County, Hills is continually learning about the practical threats of a natural disaster and the county’s resiliency.

“We’re now looking at where emergencies and climate change should be on our risk register,” she told Risk Management magazine earlier this year, adding that she frequently collaborates with the county’s climate change and emergency management offices. “There’s a lot we’re understanding about King County’s exposures to natural disasters and we’re planning for those risks and how to mitigate them.  There’s a lot of untapped resources we may need to open.”